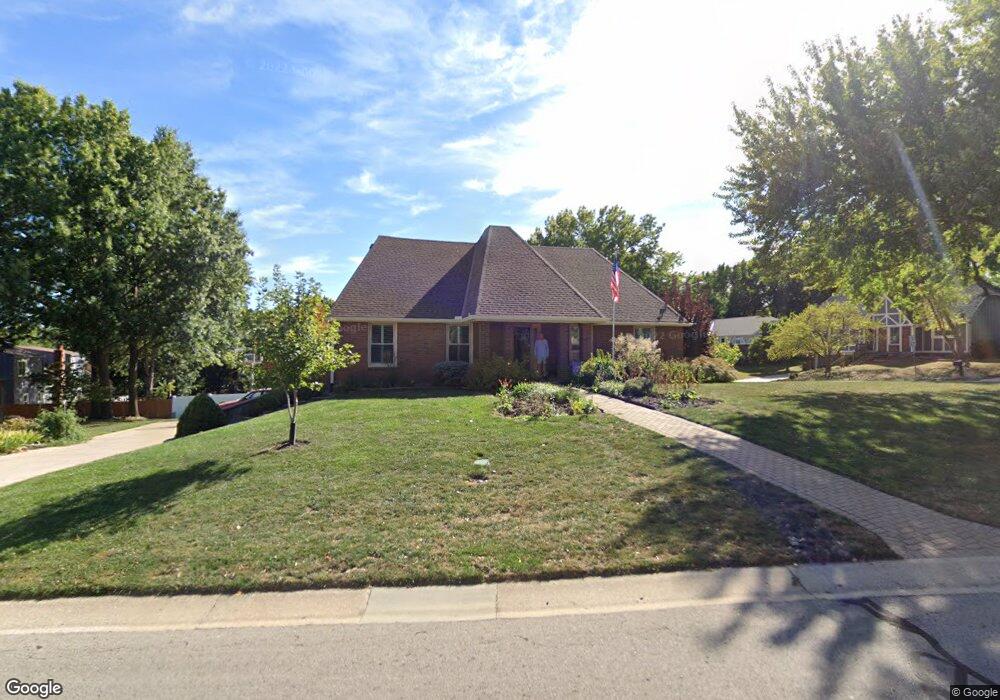
14515 W 68th St Shawnee, KS 66216
Estimated Value: $424,805 - $449,000
4
Beds
4
Baths
2,503
Sq Ft
$175/Sq Ft
Est. Value
About This Home
This home is located at 14515 W 68th St, Shawnee, KS 66216 and is currently estimated at $438,201, approximately $175 per square foot. 14515 W 68th St is a home located in Johnson County with nearby schools including Rhein Benninghoven Elementary School, Trailridge Middle School, and Shawnee Mission Northwest High School.
Ownership History
Date
Name
Owned For
Owner Type
Purchase Details
Closed on
Apr 15, 2011
Sold by
Beech Shirley Jean
Bought by
Howard J Scott and Howard Nicole A
Current Estimated Value
Home Financials for this Owner
Home Financials are based on the most recent Mortgage that was taken out on this home.
Original Mortgage
$212,473
Outstanding Balance
$147,066
Interest Rate
4.87%
Mortgage Type
FHA
Estimated Equity
$291,135
Purchase Details
Closed on
Jan 3, 2003
Sold by
Beech Shirley Jean and Beech John E
Bought by
Beech John E and Beech Shirley Jean
Home Financials for this Owner
Home Financials are based on the most recent Mortgage that was taken out on this home.
Original Mortgage
$110,000
Interest Rate
5.55%
Create a Home Valuation Report for This Property
The Home Valuation Report is an in-depth analysis detailing your home's value as well as a comparison with similar homes in the area
Home Values in the Area
Average Home Value in this Area
Purchase History
| Date | Buyer | Sale Price | Title Company |
|---|---|---|---|
| Howard J Scott | -- | Chicago Title Ins Co | |
| Beech John E | -- | Old Republic Title |
Source: Public Records
Mortgage History
| Date | Status | Borrower | Loan Amount |
|---|---|---|---|
| Open | Howard J Scott | $212,473 | |
| Previous Owner | Beech John E | $110,000 |
Source: Public Records
Tax History Compared to Growth
Tax History
| Year | Tax Paid | Tax Assessment Tax Assessment Total Assessment is a certain percentage of the fair market value that is determined by local assessors to be the total taxable value of land and additions on the property. | Land | Improvement |
|---|---|---|---|---|
| 2024 | $4,503 | $42,492 | $6,964 | $35,528 |
| 2023 | $4,381 | $40,848 | $6,964 | $33,884 |
| 2022 | $3,636 | $33,798 | $6,052 | $27,746 |
| 2021 | $3,789 | $33,051 | $5,503 | $27,548 |
| 2020 | $3,411 | $29,348 | $4,999 | $24,349 |
| 2019 | $3,244 | $27,888 | $4,544 | $23,344 |
| 2018 | $3,493 | $29,935 | $4,544 | $25,391 |
| 2017 | $3,386 | $28,566 | $3,947 | $24,619 |
| 2016 | $3,166 | $26,358 | $3,947 | $22,411 |
| 2015 | $2,921 | $25,231 | $3,947 | $21,284 |
| 2013 | -- | $24,656 | $3,947 | $20,709 |
Source: Public Records
Map
Nearby Homes
- 6942 Constance St
- 14406 W 65th Terrace
- 7029 Albervan St
- 14214 W 63rd St
- 14204 W 63rd St
- 13903 W 71st Place
- 7325 Oakview St
- 6640 Pflumm Rd
- 13415 W 66th Terrace
- 7229 Allman Dr
- 6145 Park St
- 6143 Park St
- 7219 Allman Rd
- 7239 Allman Rd
- 7221 Allman Rd
- 7237 Allman Rd
- 7231 Allman Rd
- 13800 W 75th Ct
- 12914 W 67th St
- 16128 Midland Dr
- 6805 Oakview St
- 6809 Oakview St
- 6804 Oakview St
- 14514 W 68th St
- 6802 Oakview St
- 6806 Acuff St
- 14510 W 68th St
- 14518 W 68th St
- 6808 Oakview St
- 14504 W 68th St
- 14600 W 68th St
- 6813 Oakview St
- 6810 Acuff St
- 6812 Oakview St
- 14418 W 68th St
- 6805 Alden St
- 6809 Alden St
- 14604 W 68th St
- 6801 Alden St
- 6805 Acuff St