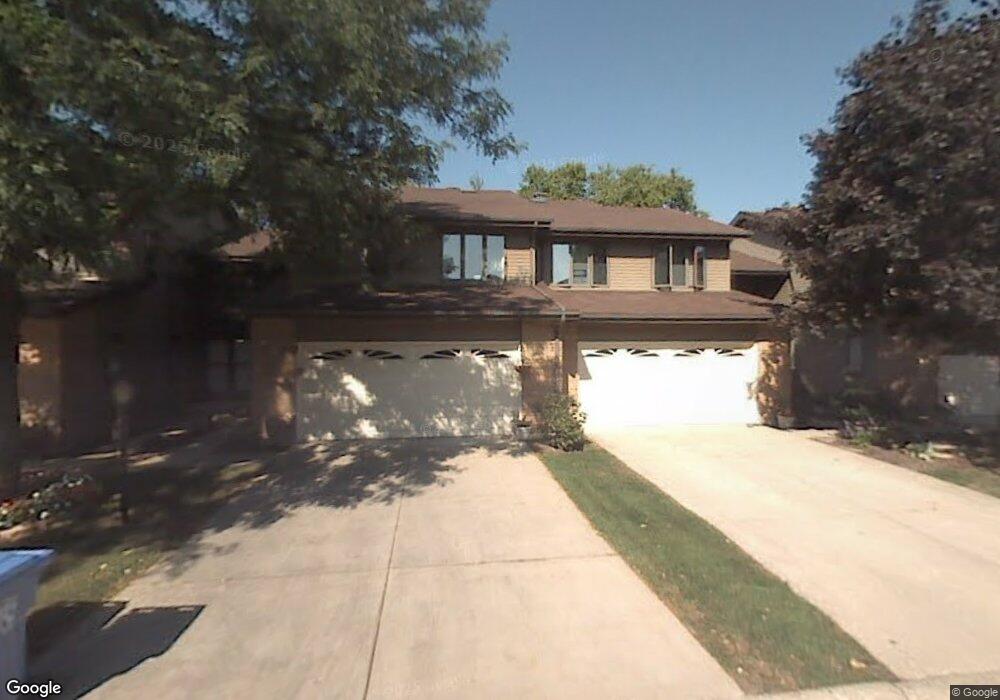
1452 N Picadilly Cir Mount Prospect, IL 60056
North Mount Prospect NeighborhoodEstimated Value: $387,002 - $450,000
3
Beds
4
Baths
1,670
Sq Ft
$247/Sq Ft
Est. Value
About This Home
This home is located at 1452 N Picadilly Cir, Mount Prospect, IL 60056 and is currently estimated at $411,751, approximately $246 per square foot. 1452 N Picadilly Cir is a home located in Cook County with nearby schools including Dwight D Eisenhower Elementary School, Anne Sullivan Elementary School, and Betsy Ross Elementary School.
Ownership History
Date
Name
Owned For
Owner Type
Purchase Details
Closed on
Aug 17, 2012
Sold by
Knoll George and Knoll Barbara
Bought by
Knoll Family Trust
Current Estimated Value
Purchase Details
Closed on
Jan 7, 2011
Sold by
Shvarts Yuriy and Shvarts Elvira
Bought by
Knoll George L and Knoll Barbara
Home Financials for this Owner
Home Financials are based on the most recent Mortgage that was taken out on this home.
Original Mortgage
$192,000
Outstanding Balance
$123,570
Interest Rate
3.87%
Mortgage Type
New Conventional
Estimated Equity
$288,181
Purchase Details
Closed on
Oct 2, 2003
Sold by
Scott Nancy J
Bought by
Shvarts Yuriy
Home Financials for this Owner
Home Financials are based on the most recent Mortgage that was taken out on this home.
Original Mortgage
$224,000
Interest Rate
4.75%
Mortgage Type
Negative Amortization
Create a Home Valuation Report for This Property
The Home Valuation Report is an in-depth analysis detailing your home's value as well as a comparison with similar homes in the area
Home Values in the Area
Average Home Value in this Area
Purchase History
| Date | Buyer | Sale Price | Title Company |
|---|---|---|---|
| Knoll Family Trust | -- | None Available | |
| Knoll George L | $240,000 | Success Title Services Inc | |
| Shvarts Yuriy | -- | Rtc |
Source: Public Records
Mortgage History
| Date | Status | Borrower | Loan Amount |
|---|---|---|---|
| Open | Knoll George L | $192,000 | |
| Previous Owner | Shvarts Yuriy | $224,000 |
Source: Public Records
Tax History
| Year | Tax Paid | Tax Assessment Tax Assessment Total Assessment is a certain percentage of the fair market value that is determined by local assessors to be the total taxable value of land and additions on the property. | Land | Improvement |
|---|---|---|---|---|
| 2025 | $6,768 | $36,000 | $5,146 | $30,854 |
| 2024 | $6,768 | $30,000 | $4,500 | $25,500 |
| 2023 | $3,207 | $30,000 | $4,500 | $25,500 |
| 2022 | $3,207 | $30,000 | $4,500 | $25,500 |
| 2021 | $3,632 | $21,138 | $4,052 | $17,086 |
| 2020 | $3,298 | $21,138 | $4,052 | $17,086 |
| 2019 | $3,263 | $23,645 | $4,052 | $19,593 |
| 2018 | $5,645 | $25,542 | $3,537 | $22,005 |
| 2017 | $3,558 | $25,542 | $3,537 | $22,005 |
| 2016 | $6,052 | $25,542 | $3,537 | $22,005 |
| 2015 | $4,797 | $19,787 | $3,087 | $16,700 |
| 2014 | $4,765 | $19,787 | $3,087 | $16,700 |
| 2013 | $4,617 | $19,787 | $3,087 | $16,700 |
Source: Public Records
Map
Nearby Homes
- 250 W Parliament Place Unit 301
- 101 W Brighton Place Unit T9
- 105 W Dover Dr Unit T3
- 1414 N Bridgeport Dr Unit T31
- 1454 N Elmhurst Rd Unit 102B
- 101 N Schoenbeck Rd
- 740 Creekside Dr Unit 510D
- 730 Creekside Dr Unit 209C
- 730 Creekside Dr Unit 405C
- 1404 Plum Ct Unit C
- 1401 Plum Ct Unit D
- 710 Creekside Dr Unit 310A
- 710 Creekside Dr Unit 104A
- 710 Creekside Dr Unit 110A
- 901 Butternut Ln Unit A
- 100 Hawthorne Place
- 206 Elm St
- 1001 Butternut Ln Unit C
- 214 N Elmhurst Rd
- 206 E Camp Mcdonald Rd
- 1454 N Picadilly Cir
- 1454 N Picadilly Cir Unit 1432
- 1450 N Picadilly Cir
- 1456 N Picadilly Cir
- 1448 N Picadilly Cir
- 1446 N Picadilly Cir
- 1458 N Picadilly Cir
- 106 W Thackery Place Unit T16
- 104 W Thackery Place Unit T15
- 1444 N Picadilly Cir
- 1447 N Picadilly Cir
- 1425 Picadilly Ct
- 102 W Thackery Place Unit T14
- 105 W Brighton Place Unit T11
- 1445 N Picadilly Cir
- 1423 N Picadilly Cir
- 1427 N Picadilly Cir
- 1442 N Picadilly Cir
- 100 W Thackery Place Unit T13
- 1443 N Picadilly Cir
Your Personal Tour Guide
Ask me questions while you tour the home.