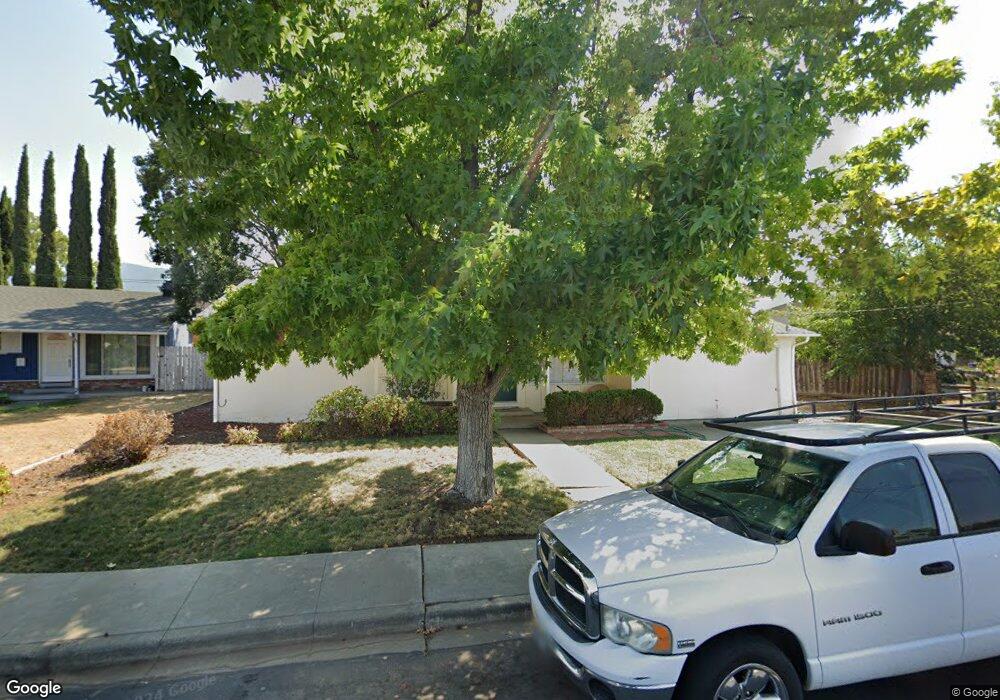
1453 Rhode Island Ct Concord, CA 94521
The Highlands NeighborhoodEstimated Value: $619,537 - $767,000
3
Beds
1
Bath
1,018
Sq Ft
$687/Sq Ft
Est. Value
About This Home
This home is located at 1453 Rhode Island Ct, Concord, CA 94521 and is currently estimated at $699,634, approximately $687 per square foot. 1453 Rhode Island Ct is a home located in Contra Costa County with nearby schools including Highlands Elementary School, Mt. Diablo Elementary School, and Pine Hollow Middle School.
Ownership History
Date
Name
Owned For
Owner Type
Purchase Details
Closed on
Jul 6, 2017
Sold by
Giannini James D
Bought by
Giannini James D
Current Estimated Value
Purchase Details
Closed on
Feb 14, 1995
Sold by
Giannini James D and Giannini Dolores
Bought by
Giannini James D
Create a Home Valuation Report for This Property
The Home Valuation Report is an in-depth analysis detailing your home's value as well as a comparison with similar homes in the area
Home Values in the Area
Average Home Value in this Area
Purchase History
| Date | Buyer | Sale Price | Title Company |
|---|---|---|---|
| Giannini James D | -- | None Available | |
| Giannini James D | -- | -- |
Source: Public Records
Tax History Compared to Growth
Tax History
| Year | Tax Paid | Tax Assessment Tax Assessment Total Assessment is a certain percentage of the fair market value that is determined by local assessors to be the total taxable value of land and additions on the property. | Land | Improvement |
|---|---|---|---|---|
| 2025 | $2,842 | $173,990 | $95,282 | $78,708 |
| 2024 | $2,768 | $170,579 | $93,414 | $77,165 |
| 2023 | $2,768 | $167,235 | $91,583 | $75,652 |
| 2022 | $2,709 | $163,957 | $89,788 | $74,169 |
| 2021 | $2,626 | $160,743 | $88,028 | $72,715 |
| 2019 | $2,562 | $155,977 | $85,418 | $70,559 |
| 2018 | $2,455 | $152,920 | $83,744 | $69,176 |
| 2017 | $2,359 | $149,922 | $82,102 | $67,820 |
| 2016 | $2,268 | $146,984 | $80,493 | $66,491 |
| 2015 | $2,213 | $144,777 | $79,284 | $65,493 |
| 2014 | $2,147 | $141,942 | $77,731 | $64,211 |
Source: Public Records
Map
Nearby Homes
- 1498 Delaware Dr
- 5540 Michigan Blvd
- 5494 Haussner Dr
- 5503 Pennsylvania Blvd
- 5555 Alabama Dr
- 5508 Connecticut Dr
- 5647 Southbrook Dr
- 5470 Roundtree Dr Unit F
- 1201 Illinois Ct
- 5665 Lewis Way
- 1821 Alicante Ct
- 1835 Camino Estrada
- 1505 Kirker Pass Rd Unit 170
- 1505 Kirker Pass Rd Unit 240
- 5333 Park Highlands Blvd Unit 34
- 5333 Park Highlands Blvd Unit 23
- 1152 Via Doble
- 1395 Kenwal Rd Unit A
- 5497 Silver Sage Ct
- 1612 Allegro Ave
- 1455 Rhode Island Ct
- 1451 Rhode Island Ct
- 5527 Indiana Dr
- 1452 Carolina Dr
- 1456 Rhode Island Ct
- 1450 Carolina Dr
- 1457 Rhode Island Ct
- 1454 Rhode Island Ct
- 1458 Rhode Island Ct
- 1452 Rhode Island Ct
- 1454 Carolina Dr
- 1460 Rhode Island Ct
- 1450 Rhode Island Ct
- 5524 Indiana Dr
- 5526 Indiana Dr
- 1451 El Camino Dr
- 5522 Indiana Dr
- 1457 El Camino Dr
- 1445 El Camino Dr
- 5528 Indiana Dr