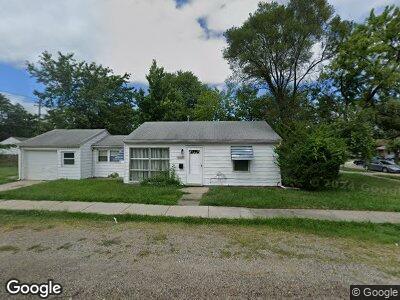
14549 Myrand St Unit Bldg-Unit Warren, MI 48089
Southeast Warren NeighborhoodEstimated Value: $84,000 - $102,000
2
Beds
2
Baths
696
Sq Ft
$134/Sq Ft
Est. Value
About This Home
This home is located at 14549 Myrand St Unit Bldg-Unit, Warren, MI 48089 and is currently estimated at $92,979, approximately $133 per square foot. 14549 Myrand St Unit Bldg-Unit is a home located in Macomb County with nearby schools including Crescentwood Elementary School, Eastpointe Middle School, and Macomb Montessori Academy.
Ownership History
Date
Name
Owned For
Owner Type
Purchase Details
Closed on
Jan 24, 2017
Sold by
Pelini Enterprises Llc
Bought by
Botnik Llc
Current Estimated Value
Purchase Details
Closed on
Jul 17, 2015
Sold by
Pelini Roberto
Bought by
Pelini Enterprises Llc
Purchase Details
Closed on
Apr 9, 2009
Sold by
Donovan Shaun
Bought by
Felini Roberto
Purchase Details
Closed on
Sep 20, 2007
Sold by
Matrix Financial Services Corp
Bought by
Hud
Purchase Details
Closed on
Jun 1, 2007
Sold by
Boza Robert J
Bought by
Matrix Financial Services Corp
Purchase Details
Closed on
Jan 30, 2001
Sold by
Tavernier John P
Bought by
Boza Robert J
Home Financials for this Owner
Home Financials are based on the most recent Mortgage that was taken out on this home.
Original Mortgage
$70,145
Interest Rate
7.13%
Mortgage Type
Purchase Money Mortgage
Purchase Details
Closed on
Nov 18, 1999
Sold by
Mernatti Robert
Bought by
Tavernier John P
Create a Home Valuation Report for This Property
The Home Valuation Report is an in-depth analysis detailing your home's value as well as a comparison with similar homes in the area
Home Values in the Area
Average Home Value in this Area
Purchase History
| Date | Buyer | Sale Price | Title Company |
|---|---|---|---|
| Botnik Llc | $27,000 | None Available | |
| Pelini Enterprises Llc | -- | None Available | |
| Felini Roberto | $8,000 | None Available | |
| Hud | -- | None Available | |
| Matrix Financial Services Corp | $70,313 | None Available | |
| Boza Robert J | $70,700 | -- | |
| Tavernier John P | $22,000 | -- |
Source: Public Records
Mortgage History
| Date | Status | Borrower | Loan Amount |
|---|---|---|---|
| Previous Owner | Boza Robert J | $70,145 |
Source: Public Records
Tax History Compared to Growth
Tax History
| Year | Tax Paid | Tax Assessment Tax Assessment Total Assessment is a certain percentage of the fair market value that is determined by local assessors to be the total taxable value of land and additions on the property. | Land | Improvement |
|---|---|---|---|---|
| 2024 | $1,235 | $34,910 | $0 | $0 |
| 2023 | $1,179 | $25,530 | $0 | $0 |
| 2022 | $1,149 | $21,630 | $0 | $0 |
| 2021 | $1,121 | $20,470 | $0 | $0 |
| 2020 | $1,087 | $18,140 | $0 | $0 |
| 2019 | $1,057 | $16,740 | $0 | $0 |
| 2018 | $24 | $15,350 | $0 | $0 |
| 2017 | $1,050 | $15,020 | $1,990 | $13,030 |
| 2016 | $2,040 | $15,020 | $0 | $0 |
| 2015 | -- | $13,260 | $0 | $0 |
| 2012 | -- | $15,630 | $0 | $0 |
Source: Public Records
Map
Nearby Homes
- 21315 La Salle Blvd
- 21228 La Salle Blvd
- 21515 La Salle Blvd
- 21312 Dexter Blvd
- 21136 Nummer St
- 21150 Gentner St
- 21319 Beechwood Ave
- 21119 Beechwood Ave
- 21794 Nummer Ave
- 20951 Nummer St
- 21054 Ehlert Ave
- 14661 Lydia Ave
- 21738 Firwood Ave
- 14725 Agnes Ave
- 13985 Toepfer Rd
- 20834 Eastwood Blvd
- 14220 Freeman St
- 21740 Wellington Ave
- 20766 Ehlert Ave
- 13918 Ida Ave
- 14549 Myrand St Unit Bldg-Unit
- 14549 Myrand St
- 21233 La Salle Blvd
- 21307 La Salle Blvd
- 21187 La Salle Blvd
- 14515 Myrand St
- 21320 Nummer St
- 21330 Nummer St
- 21323 La Salle Blvd
- 21340 Nummer St
- 21194 Nummer St
- 21212 La Salle Blvd
- 21304 La Salle Blvd
- 21175 La Salle Blvd
- 21333 La Salle Blvd
- 21188 La Salle Blvd
- 21312 La Salle Blvd
- 21350 Nummer St
- 21182 La Salle Blvd
- 21320 La Salle Blvd