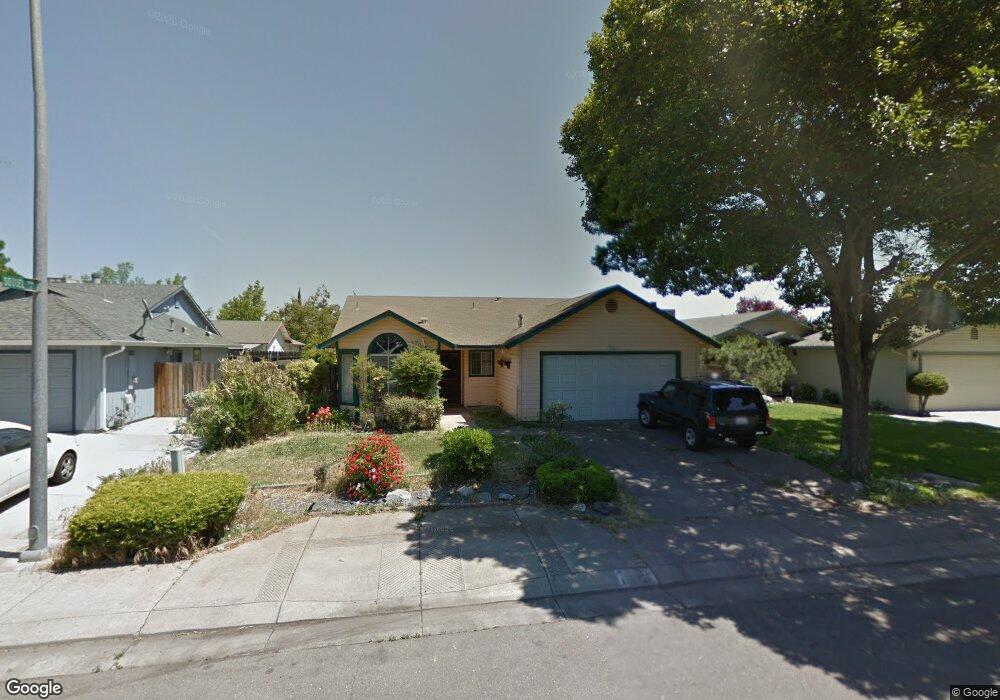
1455 Capitola Cir Stockton, CA 95206
Seaport NeighborhoodEstimated Value: $389,000 - $420,000
3
Beds
2
Baths
1,311
Sq Ft
$308/Sq Ft
Est. Value
About This Home
This home is located at 1455 Capitola Cir, Stockton, CA 95206 and is currently estimated at $404,313, approximately $308 per square foot. 1455 Capitola Cir is a home located in San Joaquin County with nearby schools including John Marshall Elementary School, San Joaquin Elementary School, and Taylor Leadership Academy.
Ownership History
Date
Name
Owned For
Owner Type
Purchase Details
Closed on
Feb 13, 2019
Sold by
Li Wei and Li Qiang Yanyan
Bought by
Li Wei and Li Qiang Yanyan
Current Estimated Value
Purchase Details
Closed on
Dec 4, 2009
Sold by
Lenders Financial Group Llc
Bought by
Li Wei and Qiang Yanyan
Home Financials for this Owner
Home Financials are based on the most recent Mortgage that was taken out on this home.
Original Mortgage
$87,750
Outstanding Balance
$57,558
Interest Rate
5.01%
Mortgage Type
New Conventional
Estimated Equity
$346,755
Purchase Details
Closed on
Sep 18, 2009
Sold by
Esguerra Emmanuel and Esguerra Maryann C
Bought by
Lenders Financial Group Llc
Purchase Details
Closed on
Jul 3, 2007
Sold by
Esguerra Emmanuel and Esguerra Mary Ann C
Bought by
Esguerra Emmanuel A and Esguerra Mary Ann C
Purchase Details
Closed on
Oct 13, 2004
Sold by
Raymond Randall Charles and Raymond Peggy L
Bought by
Esquerra Emmanuel and Esquerra Mary Ann
Home Financials for this Owner
Home Financials are based on the most recent Mortgage that was taken out on this home.
Original Mortgage
$223,200
Interest Rate
1.37%
Mortgage Type
Negative Amortization
Create a Home Valuation Report for This Property
The Home Valuation Report is an in-depth analysis detailing your home's value as well as a comparison with similar homes in the area
Home Values in the Area
Average Home Value in this Area
Purchase History
| Date | Buyer | Sale Price | Title Company |
|---|---|---|---|
| Li Wei | -- | None Available | |
| Li Wei | -- | Chicago Title Company | |
| Lenders Financial Group Llc | $72,000 | None Available | |
| Esguerra Emmanuel A | -- | None Available | |
| Esquerra Emmanuel | $279,000 | Chicago Title Co |
Source: Public Records
Mortgage History
| Date | Status | Borrower | Loan Amount |
|---|---|---|---|
| Open | Li Wei | $87,750 | |
| Previous Owner | Esquerra Emmanuel | $223,200 | |
| Closed | Esquerra Emmanuel | $27,900 |
Source: Public Records
Tax History Compared to Growth
Tax History
| Year | Tax Paid | Tax Assessment Tax Assessment Total Assessment is a certain percentage of the fair market value that is determined by local assessors to be the total taxable value of land and additions on the property. | Land | Improvement |
|---|---|---|---|---|
| 2025 | $2,014 | $151,012 | $37,428 | $113,584 |
| 2024 | $1,981 | $148,052 | $36,695 | $111,357 |
| 2023 | $1,937 | $145,150 | $35,976 | $109,174 |
| 2022 | $1,825 | $142,305 | $35,271 | $107,034 |
| 2021 | $1,760 | $139,516 | $34,580 | $104,936 |
| 2020 | $1,793 | $138,087 | $34,226 | $103,861 |
| 2019 | $1,786 | $135,380 | $33,555 | $101,825 |
| 2018 | $2,177 | $132,727 | $32,898 | $99,829 |
| 2017 | $1,996 | $130,125 | $32,253 | $97,872 |
| 2016 | $2,007 | $127,574 | $31,621 | $95,953 |
| 2014 | $1,912 | $123,198 | $30,536 | $92,662 |
Source: Public Records
Map
Nearby Homes
- 1413 Laguna Cir
- 1409 Laguna Cir
- 1156 Derrick Dr
- 2128 Green River Ln
- 2242 Port Trinity Cir
- 1823 Fort Hall Place
- 864 W 5th St
- 1232 Denver Ave
- 2650 S Fresno Ave
- 2050 Grey Stone Dr
- 509 Howard St
- 3504 French Camp Turnpike
- 426 Howard St
- 539 Buena Vida Ct
- 1932 S Lincoln St
- 407 W 7th St
- 2217 S Lincoln St
- 364 W 7th St
- 332 Kolher St
- 314 Kolher St
- 1459 Capitola Cir
- 1451 Capitola Cir
- 2103 Erica Place
- 2105 Erica Place
- 1463 Capitola Cir
- 1447 Capitola Cir
- 2071 Erica Place
- 1406 Soquel Ln
- 2043 Erica Place
- 1443 Capitola Cir
- 1467 Capitola Cir
- 1407 Soquel Ln
- 1405 Aptos Ln
- 1438 Soquel Ln
- 2025 Erica Place
- 1439 Soquel Ln
- 1439 Capitola Cir
- 1388 Derrick Dr
- 1437 Aptos Ln
- 1484 Capitola Cir