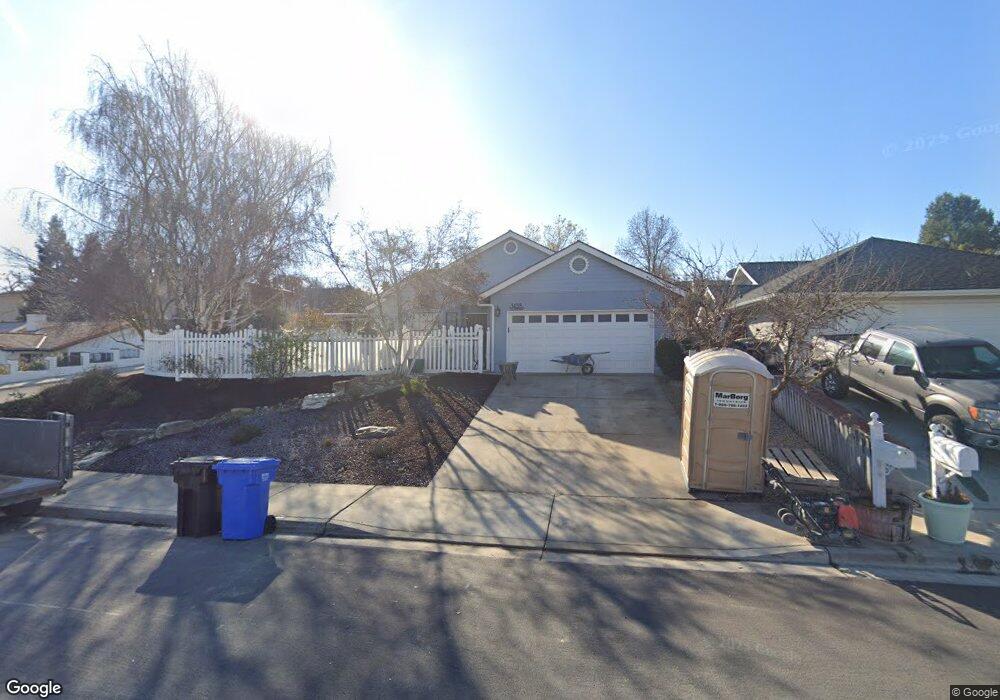
1455 Godell St Templeton, CA 93465
Estimated Value: $761,017 - $956,000
3
Beds
2
Baths
1,440
Sq Ft
$594/Sq Ft
Est. Value
About This Home
This home is located at 1455 Godell St, Templeton, CA 93465 and is currently estimated at $855,754, approximately $594 per square foot. 1455 Godell St is a home located in San Luis Obispo County with nearby schools including Vineyard Elementary School, Templeton Elementary School, and Templeton Middle School.
Ownership History
Date
Name
Owned For
Owner Type
Purchase Details
Closed on
Mar 17, 2025
Sold by
Barnes John D and Barnes Shawn K
Bought by
John D And Shawn K Barnes Family Trust and Barnes
Current Estimated Value
Purchase Details
Closed on
May 10, 1999
Sold by
Dutra Richard Carl and Dutra Deborah G
Bought by
Barnes John D and Barnes Shawn K
Home Financials for this Owner
Home Financials are based on the most recent Mortgage that was taken out on this home.
Original Mortgage
$170,550
Interest Rate
6.86%
Create a Home Valuation Report for This Property
The Home Valuation Report is an in-depth analysis detailing your home's value as well as a comparison with similar homes in the area
Home Values in the Area
Average Home Value in this Area
Purchase History
| Date | Buyer | Sale Price | Title Company |
|---|---|---|---|
| John D And Shawn K Barnes Family Trust | -- | None Listed On Document | |
| Barnes John D | $189,500 | Chicago Title Co |
Source: Public Records
Mortgage History
| Date | Status | Borrower | Loan Amount |
|---|---|---|---|
| Previous Owner | Barnes John D | $170,550 |
Source: Public Records
Tax History Compared to Growth
Tax History
| Year | Tax Paid | Tax Assessment Tax Assessment Total Assessment is a certain percentage of the fair market value that is determined by local assessors to be the total taxable value of land and additions on the property. | Land | Improvement |
|---|---|---|---|---|
| 2025 | $3,966 | $356,296 | $125,404 | $230,892 |
| 2024 | $3,894 | $349,311 | $122,946 | $226,365 |
| 2023 | $3,894 | $342,463 | $120,536 | $221,927 |
| 2022 | $3,819 | $335,749 | $118,173 | $217,576 |
| 2021 | $3,744 | $329,166 | $115,856 | $213,310 |
| 2020 | $3,705 | $325,792 | $114,669 | $211,123 |
| 2019 | $3,454 | $319,405 | $112,421 | $206,984 |
| 2018 | $3,386 | $313,143 | $110,217 | $202,926 |
| 2017 | $3,319 | $307,004 | $108,056 | $198,948 |
| 2016 | $3,254 | $300,986 | $105,938 | $195,048 |
| 2015 | $3,205 | $296,466 | $104,347 | $192,119 |
| 2014 | $3,087 | $290,659 | $102,303 | $188,356 |
Source: Public Records
Map
Nearby Homes
- 1609 Tanager Ct
- 553 Well Rd
- 1730 Sandalwood Ln
- 0 Bennett Way
- 367 Lily Pad Ln
- 750 Gough Ave
- 117 Frontier Way
- 730 Rosebay Way
- 720 Gough Ave
- 1220 Bennett Way
- 1220 Bennett Way Unit 97
- 1220 Bennett Way Unit 83
- 30 Corrietta Ct
- 59 8th St
- 115 Booker Rd
- 0 Old Creek Rd
- 720 Wild Oats Way
- 8 Championship Ln
- 2455 Ca-46
- 2455 W Highway 46
- 1465 Godell St
- 1416 Pamela Ct
- 1432 Pamela Ct
- 1445 Godell St
- 1475 Godell St
- 1448 Pamela Ct
- 1380 Pamela Ct Unit L1
- 1380 Pamela Ct
- 1440 Godell St
- 1450 Godell St
- 1430 Godell St
- 1460 Godell St
- 1485 Godell St
- 1420 Godell St
- 1464 Pamela Ct
- 1350 Pamela Ct Unit L2
- 1350 Pamela Ct
- 1470 Godell St
- 1435 Godell St
- 1413 Pamela Ct