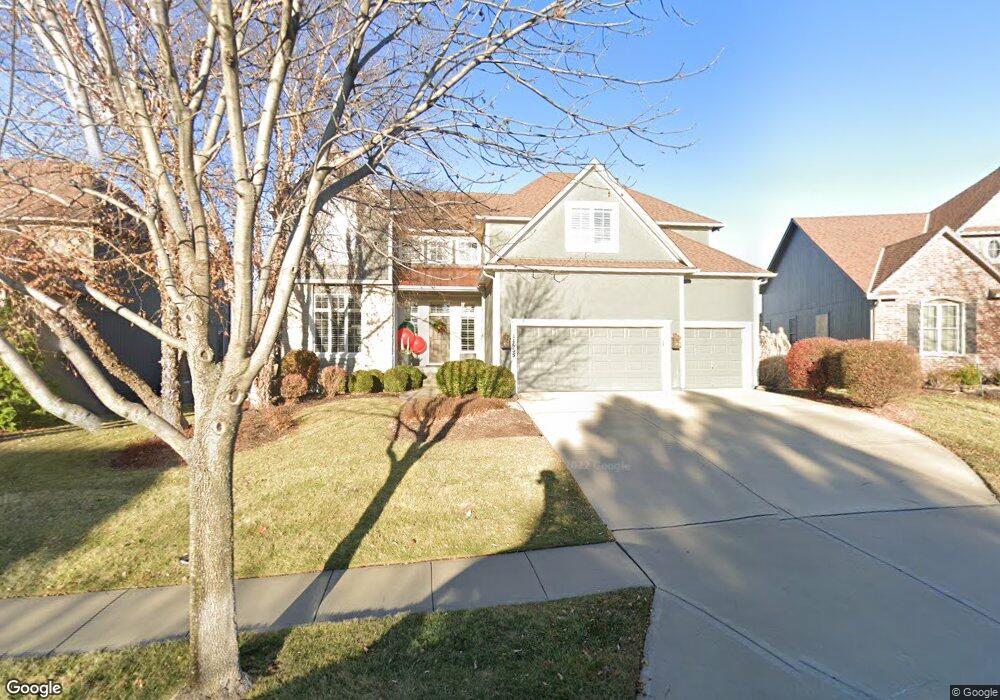
14555 S Cody St Olathe, KS 66062
Estimated Value: $671,379 - $900,000
4
Beds
4
Baths
3,603
Sq Ft
$208/Sq Ft
Est. Value
About This Home
This home is located at 14555 S Cody St, Olathe, KS 66062 and is currently estimated at $748,345, approximately $207 per square foot. 14555 S Cody St is a home located in Johnson County with nearby schools including Morse Elementary School, Aubry Bend Middle School, and Blue Valley Southwest High School.
Ownership History
Date
Name
Owned For
Owner Type
Purchase Details
Closed on
Jul 19, 2025
Sold by
Magness Ray
Bought by
Dixon-Magness Heather
Current Estimated Value
Purchase Details
Closed on
Nov 22, 2005
Sold by
Kensington Land Development Iii Llc
Bought by
Jim Haas Builders Inc
Home Financials for this Owner
Home Financials are based on the most recent Mortgage that was taken out on this home.
Original Mortgage
$330,700
Interest Rate
6.12%
Mortgage Type
New Conventional
Purchase Details
Closed on
Oct 17, 2005
Sold by
Jim Haas Builders Inc
Bought by
Magness Raymond W and Dixon Magness Heather L
Home Financials for this Owner
Home Financials are based on the most recent Mortgage that was taken out on this home.
Original Mortgage
$330,700
Interest Rate
6.12%
Mortgage Type
New Conventional
Create a Home Valuation Report for This Property
The Home Valuation Report is an in-depth analysis detailing your home's value as well as a comparison with similar homes in the area
Home Values in the Area
Average Home Value in this Area
Purchase History
| Date | Buyer | Sale Price | Title Company |
|---|---|---|---|
| Dixon-Magness Heather | -- | None Listed On Document | |
| Dixon-Magness Heather | -- | None Listed On Document | |
| Jim Haas Builders Inc | -- | First American Title Insuran | |
| Magness Raymond W | -- | First American Title Insuran |
Source: Public Records
Mortgage History
| Date | Status | Borrower | Loan Amount |
|---|---|---|---|
| Previous Owner | Jim Haas Builders Inc | $330,700 | |
| Previous Owner | Magness Raymond W | $330,700 |
Source: Public Records
Tax History Compared to Growth
Tax History
| Year | Tax Paid | Tax Assessment Tax Assessment Total Assessment is a certain percentage of the fair market value that is determined by local assessors to be the total taxable value of land and additions on the property. | Land | Improvement |
|---|---|---|---|---|
| 2024 | $7,600 | $70,852 | $11,175 | $59,677 |
| 2023 | $7,707 | $70,783 | $11,175 | $59,608 |
| 2022 | $6,555 | $58,822 | $10,152 | $48,670 |
| 2021 | $6,537 | $55,832 | $9,233 | $46,599 |
| 2020 | $6,806 | $57,235 | $9,233 | $48,002 |
| 2019 | $6,580 | $54,246 | $9,628 | $44,618 |
| 2018 | $6,553 | $53,003 | $8,359 | $44,644 |
| 2017 | $6,264 | $49,703 | $8,359 | $41,344 |
| 2016 | $6,255 | $49,680 | $7,662 | $42,018 |
| 2015 | $6,147 | $48,219 | $7,662 | $40,557 |
| 2013 | -- | $45,448 | $8,983 | $36,465 |
Source: Public Records
Map
Nearby Homes
- 11610 W 147th St
- 14622 S Garnett St
- 11130 W 146th Terrace
- 11801 W 149th St
- 11110 W 146th Terrace
- 14308 Barton St
- The Breckenridge Plan at Polo Fields
- The Laguna Plan at Polo Fields
- The Laguna 1.5 Story Plan at Polo Fields
- The Santa Barbara Plan at Polo Fields
- Windsor Plan at Chapel Hill
- Bristol Plan at Chapel Hill
- 14157 Bond St
- 11814 W 149th St
- 11907 W 143rd St
- 14124 Flint St
- 14516 Reeder St
- 14115 Cody St
- 12400 W 148th St
- 14334 S Caenen Ln
- 14545 S Cody St
- 14565 S Cody St
- 14535 S Cody St
- 14585 S Cody St
- 11522 W 146th St
- 14544 S Cody St
- 11476 W 146th St
- 14534 S Cody St
- 11541 W 144th Place
- 11527 W 144th Place
- 14524 S Cody St
- 11563 W 144th Place
- 11456 W 146th St
- 11587 W 144th Place
- 11543 W 146th St
- 11523 W 146th St
- 11455 W 146th St
- 11648 W 146th St
- 11607 W 144th Place
- 11563 W 146th St