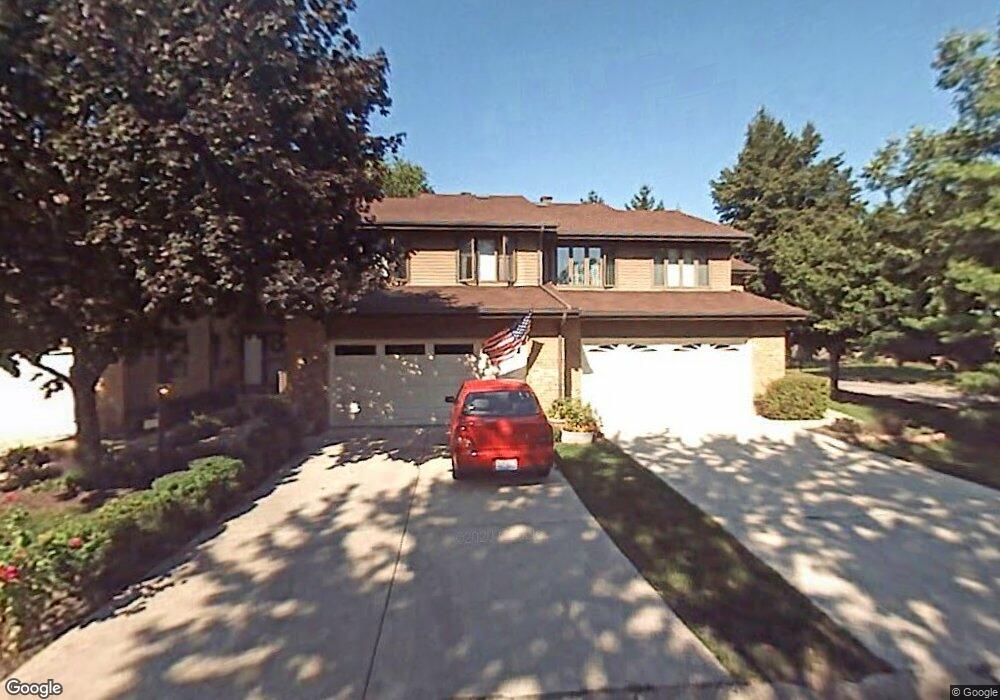
1456 N Picadilly Cir Mount Prospect, IL 60056
North Mount Prospect NeighborhoodEstimated Value: $395,000 - $418,000
3
Beds
3
Baths
1,670
Sq Ft
$244/Sq Ft
Est. Value
About This Home
This home is located at 1456 N Picadilly Cir, Mount Prospect, IL 60056 and is currently estimated at $407,920, approximately $244 per square foot. 1456 N Picadilly Cir is a home located in Cook County with nearby schools including Dwight D Eisenhower Elementary School, Anne Sullivan Elementary School, and Betsy Ross Elementary School.
Ownership History
Date
Name
Owned For
Owner Type
Purchase Details
Closed on
May 26, 2004
Sold by
Bratko Beata and Godyn Victor
Bought by
Mazer Michael and Mazer Elizabeth
Current Estimated Value
Home Financials for this Owner
Home Financials are based on the most recent Mortgage that was taken out on this home.
Original Mortgage
$235,000
Outstanding Balance
$115,339
Interest Rate
6.06%
Mortgage Type
Unknown
Estimated Equity
$292,581
Purchase Details
Closed on
May 25, 1999
Sold by
Glaister Andrew J
Bought by
Godyn Victor and Bratko Beata
Home Financials for this Owner
Home Financials are based on the most recent Mortgage that was taken out on this home.
Original Mortgage
$168,000
Interest Rate
6.92%
Purchase Details
Closed on
Jun 28, 1996
Sold by
Garan C J and Garan Carol L
Bought by
Glaister Andrew J
Home Financials for this Owner
Home Financials are based on the most recent Mortgage that was taken out on this home.
Original Mortgage
$152,400
Interest Rate
6.75%
Create a Home Valuation Report for This Property
The Home Valuation Report is an in-depth analysis detailing your home's value as well as a comparison with similar homes in the area
Home Values in the Area
Average Home Value in this Area
Purchase History
| Date | Buyer | Sale Price | Title Company |
|---|---|---|---|
| Mazer Michael | $317,000 | Stewart Title Of Illinois | |
| Godyn Victor | $210,000 | -- | |
| Glaister Andrew J | $190,500 | Attorneys Title Guaranty Fun |
Source: Public Records
Mortgage History
| Date | Status | Borrower | Loan Amount |
|---|---|---|---|
| Open | Mazer Michael | $235,000 | |
| Previous Owner | Godyn Victor | $168,000 | |
| Previous Owner | Glaister Andrew J | $152,400 |
Source: Public Records
Tax History Compared to Growth
Tax History
| Year | Tax Paid | Tax Assessment Tax Assessment Total Assessment is a certain percentage of the fair market value that is determined by local assessors to be the total taxable value of land and additions on the property. | Land | Improvement |
|---|---|---|---|---|
| 2024 | $6,768 | $30,000 | $4,500 | $25,500 |
| 2023 | $6,447 | $30,000 | $4,500 | $25,500 |
| 2022 | $6,447 | $30,000 | $4,500 | $25,500 |
| 2021 | $4,763 | $21,138 | $4,047 | $17,091 |
| 2020 | $4,769 | $21,138 | $4,047 | $17,091 |
| 2019 | $4,795 | $23,645 | $4,047 | $19,598 |
| 2018 | $5,798 | $25,360 | $3,533 | $21,827 |
| 2017 | $6,683 | $25,360 | $3,533 | $21,827 |
| 2016 | $7,374 | $28,400 | $3,533 | $24,867 |
| 2015 | $4,299 | $16,285 | $3,084 | $13,201 |
| 2014 | $4,249 | $16,285 | $3,084 | $13,201 |
| 2013 | $4,867 | $18,735 | $3,084 | $15,651 |
Source: Public Records
Map
Nearby Homes
- 107 W Brighton Place Unit T12
- 211 W Hanover Place Unit T85
- 1400 N Yarmouth Place Unit 113
- 1400 N Yarmouth Place Unit 315
- 1428 N Bridgeport Dr Unit T37
- 1400 N Elmhurst Rd Unit 302
- 1400 N Elmhurst Rd Unit 106
- 802 Butternut Ln Unit C
- 802 Butternut Ln Unit D
- 730 Creekside Dr Unit 405C
- 740 Creekside Dr Unit 510D
- 710 Creekside Dr Unit 506A
- 1401 Plum Ct Unit D
- 1311 Nutmeg Ct Unit A
- 910 Persimmon Ln Unit A
- 206 E Camp Mcdonald Rd
- 108 N Meadow Ln
- 302 Lonsdale Rd
- 412 W Olive Ave
- 2443 E Brandenberry Ct Unit 2A
- 1454 N Picadilly Cir
- 1454 N Picadilly Cir Unit 1432
- 1452 N Picadilly Cir
- 1450 N Picadilly Cir
- 1458 N Picadilly Cir
- 1448 N Picadilly Cir
- 106 W Thackery Place Unit T16
- 1447 N Picadilly Cir
- 1446 N Picadilly Cir
- 104 W Thackery Place Unit T15
- 105 W Brighton Place Unit T11
- 1445 N Picadilly Cir
- 1425 Picadilly Ct
- 1444 N Picadilly Cir
- 102 W Thackery Place Unit T14
- 1460 N Picadilly Cir Unit 6
- 103 W Brighton Place Unit T10
- 1443 N Picadilly Cir
- 100 W Thackery Place Unit T13
- 1427 N Picadilly Cir