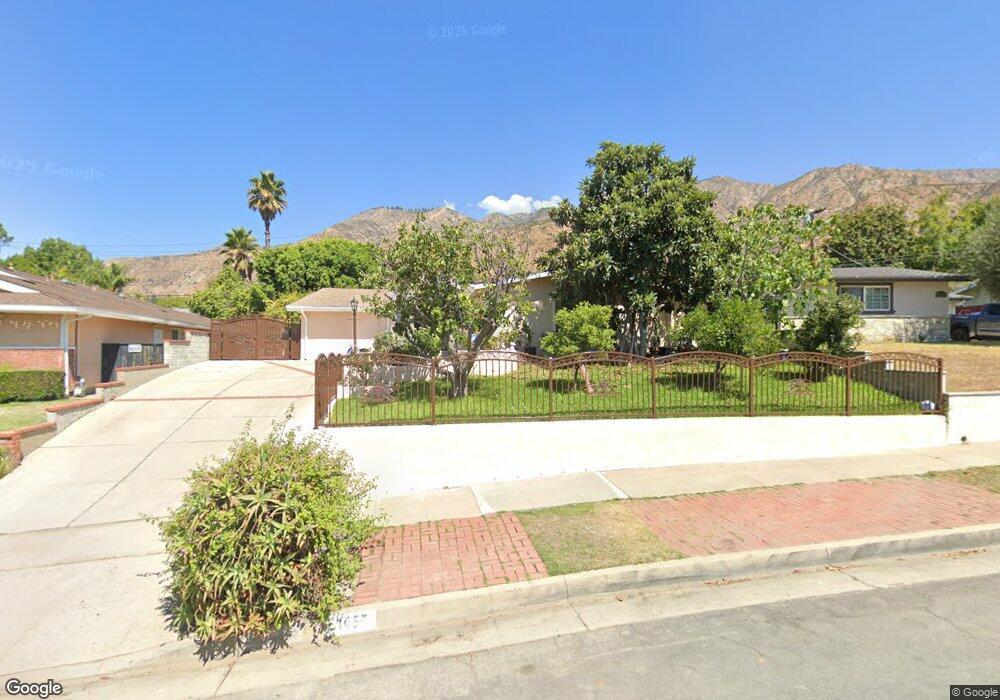
1457 Daveric Dr Pasadena, CA 91107
Upper Hastings Ranch NeighborhoodEstimated Value: $1,360,803 - $1,513,000
3
Beds
2
Baths
1,764
Sq Ft
$815/Sq Ft
Est. Value
About This Home
This home is located at 1457 Daveric Dr, Pasadena, CA 91107 and is currently estimated at $1,437,201, approximately $814 per square foot. 1457 Daveric Dr is a home located in Los Angeles County with nearby schools including Don Benito Fundamental, Pasadena High School, and Bethany Christian School.
Ownership History
Date
Name
Owned For
Owner Type
Purchase Details
Closed on
Mar 16, 2012
Sold by
Keshishian Makrui and The Makrui Keshishian Family L
Bought by
Keshishian Samson and The Samson Keshishian Family L
Current Estimated Value
Purchase Details
Closed on
Dec 28, 2011
Sold by
Keshishian Makrui
Bought by
Keshishian Samson and The Samson Keshishian Family L
Purchase Details
Closed on
Apr 23, 2001
Sold by
Keshishian Makrui
Bought by
Keshishian Makrui and The Makrui Keshishian Family L
Purchase Details
Closed on
Jun 5, 2000
Sold by
Keshishian Samson
Bought by
Keshishian Makrui
Home Financials for this Owner
Home Financials are based on the most recent Mortgage that was taken out on this home.
Original Mortgage
$20,000
Interest Rate
8.27%
Mortgage Type
Credit Line Revolving
Purchase Details
Closed on
Feb 12, 1999
Sold by
Keshishian Samson
Bought by
Keshishyan Makrui
Create a Home Valuation Report for This Property
The Home Valuation Report is an in-depth analysis detailing your home's value as well as a comparison with similar homes in the area
Home Values in the Area
Average Home Value in this Area
Purchase History
| Date | Buyer | Sale Price | Title Company |
|---|---|---|---|
| Keshishian Samson | -- | None Available | |
| Keshishian Samson | -- | None Available | |
| Keshishian Makrui | -- | -- | |
| Keshishian Makrui | -- | American Title Co | |
| Keshishyan Makrui | -- | -- |
Source: Public Records
Mortgage History
| Date | Status | Borrower | Loan Amount |
|---|---|---|---|
| Previous Owner | Keshishian Makrui | $20,000 |
Source: Public Records
Tax History
| Year | Tax Paid | Tax Assessment Tax Assessment Total Assessment is a certain percentage of the fair market value that is determined by local assessors to be the total taxable value of land and additions on the property. | Land | Improvement |
|---|---|---|---|---|
| 2025 | $4,460 | $363,645 | $230,633 | $133,012 |
| 2024 | $4,460 | $356,515 | $226,111 | $130,404 |
| 2023 | $4,420 | $349,526 | $221,678 | $127,848 |
| 2022 | $4,275 | $342,674 | $217,332 | $125,342 |
| 2021 | $4,103 | $335,956 | $213,071 | $122,885 |
| 2019 | $3,958 | $325,993 | $206,752 | $119,241 |
| 2018 | $3,875 | $319,602 | $202,699 | $116,903 |
| 2016 | $3,727 | $307,193 | $194,829 | $112,364 |
| 2015 | $3,684 | $302,580 | $191,903 | $110,677 |
| 2014 | $3,617 | $296,653 | $188,144 | $108,509 |
Source: Public Records
Map
Nearby Homes
- 1420 Riviera Dr
- 3880 Startouch Dr
- 526 N Michillinda Ave
- 1220 Tropical Ave
- 1140 Daveric Dr
- 3984 Park Vista Cir
- 3577 Shaw Ranch Rd
- 661 W Alegria Ave
- 589 W Grandview Ave
- 3263 New York Dr
- 1045 Sierra Madre Villa Ave
- 230 N Sunnyside Ave
- 2060 Windover Rd
- 442 Crestvale Dr
- 347 N Grove St
- 2905 New York Dr
- 225 N Lima St
- 1701 Country Ln
- 650 Sierra Meadow Dr
- 3325 Primavera St
- 1459 Daveric Dr
- 1455 Daveric Dr
- 3680 Alder Ln
- 1461 Daveric Dr
- 1453 Daveric Dr
- 3700 Alder Ln
- 3670 Alder Ln
- 1458 Daveric Dr
- 3710 Alder Ln
- 1454 Daveric Dr
- 1451 Daveric Dr
- 1460 Daveric Dr
- 3660 Alder Ln
- 1490 Riviera Dr
- 1450 Daveric Dr
- 1480 Riviera Dr
- 1449 Daveric Dr
- 3675 Denair St
- 3675 Alder Ln
- 3685 Alder Ln
Your Personal Tour Guide
Ask me questions while you tour the home.