1458 Northview Place Redlands, CA 92374
South Redlands NeighborhoodEstimated Value: $624,086 - $773,000
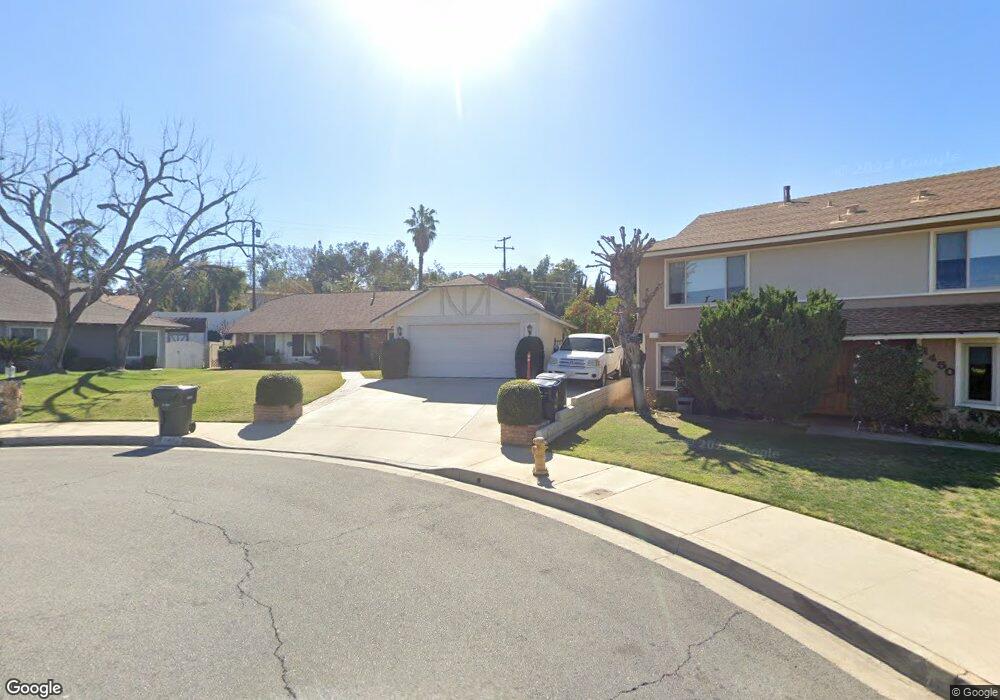
About This Home
This home is located at 1458 Northview Place, Redlands, CA 92374 and is currently estimated at $716,272, approximately $398 per square foot. 1458 Northview Place is a home located in San Bernardino County with nearby schools including Mariposa Elementary School, Moore Middle School, and Redlands East Valley High School.
Ownership History
We collect this data history from publicly available records. To have your information removed, we recommend requesting removal directly through your county’s website.
Purchase Details
Home Financials for this Owner
Home Financials are based on the most recent Mortgage that was taken out on this home.Purchase Details
Home Financials for this Owner
Home Financials are based on the most recent Mortgage that was taken out on this home.Purchase Details
Home Financials for this Owner
Home Financials are based on the most recent Mortgage that was taken out on this home.Home Values in the Area
Average Home Value in this Area
Purchase History
We collect this data history from publicly available records. To have your information removed, we recommend requesting removal directly through your county’s website.
| Date | Buyer | Sale Price | Title Company |
|---|---|---|---|
| $415,000 | Stewart Title Of Ca Inc | ||
| $325,000 | Ticor Title Company | ||
| $180,000 | Commonwealth Land Title Co |
Mortgage History
We collect this data history from publicly available records. To have your information removed, we recommend requesting removal directly through your county’s website.
| Date | Status | Borrower | Loan Amount |
|---|---|---|---|
| Open | $373,400 | ||
| Previous Owner | $319,113 | ||
| Previous Owner | $144,000 |
Tax History
We collect this data history from publicly available records. To have your information removed, we recommend requesting removal directly through your county’s website.
| Year | Tax Paid | Tax Assessment Tax Assessment Total Assessment is a certain percentage of the fair market value that is determined by local assessors to be the total taxable value of land and additions on the property. | Land | Improvement |
|---|---|---|---|---|
| 2025 | $5,904 | $481,645 | $144,494 | $337,151 |
| 2024 | $5,510 | $472,201 | $141,661 | $330,540 |
| 2023 | $5,502 | $462,942 | $138,883 | $324,059 |
| 2022 | $5,421 | $453,865 | $136,160 | $317,705 |
| 2021 | $5,518 | $444,965 | $133,490 | $311,475 |
| 2020 | $5,435 | $440,402 | $132,121 | $308,281 |
| 2019 | $5,281 | $431,766 | $129,530 | $302,236 |
| 2018 | $5,148 | $423,300 | $126,990 | $296,310 |
| 2017 | $5,103 | $415,000 | $124,500 | $290,500 |
| 2016 | $4,388 | $354,383 | $106,315 | $248,068 |
| 2015 | $4,354 | $349,060 | $104,718 | $244,342 |
| 2014 | $4,273 | $342,223 | $102,667 | $239,556 |
Map
- 1426 5th Ave
- 1442 Moore St
- 1452 Moore St
- 1458 Moore St
- 1424 Moore St
- 1550 Marion Rd
- 1479 Moore St
- 1200 E Highland Ave Unit 406
- 1454 E Highland Ave
- 1506 Crestview Rd
- 1021 Cimarron Dr
- 210 Jesse Way
- 1010 Cimarron Ct
- 711 Afton Ct
- 4 Dearborn Cir
- 1562 E Citrus Ave
- 1621 Arcata Dr
- 15 Naomi St
- 123 S La Salle St
- 1592 Christopher Ln
- 1450 Northview Place
- 1466 Northview Place
- 1441 Pleasantview Dr
- 1481 Pleasantview Dr
- 1433 Pleasantview Dr
- 1473 Pleasantview Dr
- 1489 Pleasantview Dr
- 1449 Pleasantview Dr
- 1467 Northview Place
- 1512 Marion Rd
- 1436 Northview Place
- 1425 Pleasantview Dr
- 1465 Pleasantview Dr
- 1514 Marion Rd
- 1459 Northview Place
- 1510 Marion Rd
- 1457 Pleasantview Dr
- 1451 Northview Place
- 1417 Pleasantview Dr
- 1434 Pleasantview Dr
Ask me questions while you tour the home.