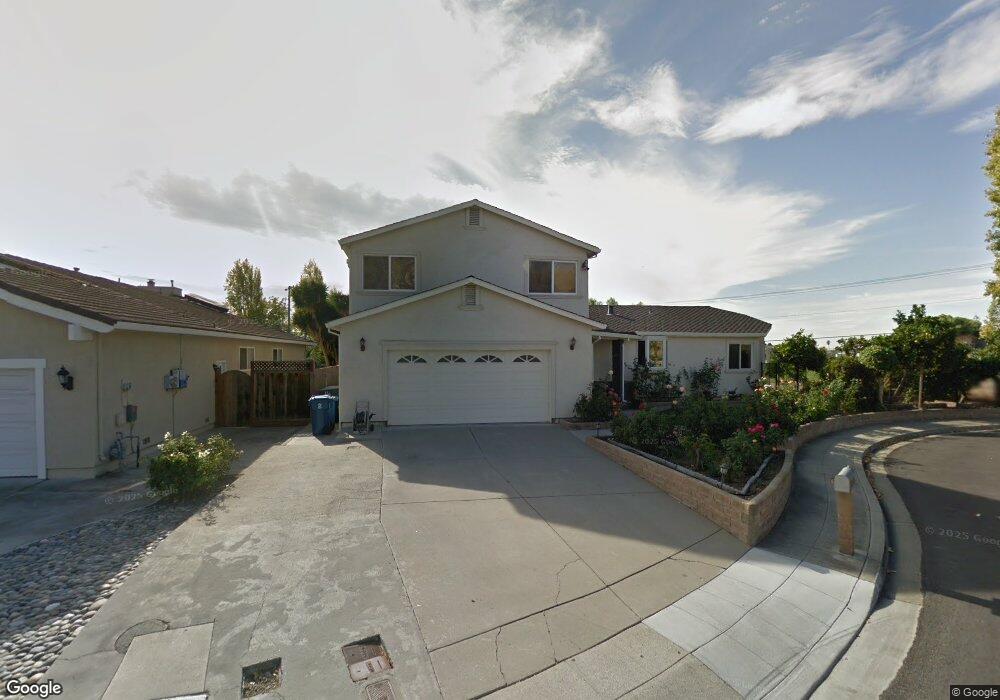
1459 N Hillview Dr Milpitas, CA 95035
Estimated Value: $2,202,000 - $2,538,000
3
Beds
3
Baths
2,825
Sq Ft
$851/Sq Ft
Est. Value
About This Home
This home is located at 1459 N Hillview Dr, Milpitas, CA 95035 and is currently estimated at $2,402,832, approximately $850 per square foot. 1459 N Hillview Dr is a home located in Santa Clara County with nearby schools including Marshall Pomeroy Elementary School, Thomas Russell Middle School, and Milpitas High School.
Ownership History
Date
Name
Owned For
Owner Type
Purchase Details
Closed on
Jun 23, 1998
Sold by
Ullah Zaray Ihsan and Zaray Shahirah
Bought by
Zaray Sajiah and Zaray Khalil
Current Estimated Value
Purchase Details
Closed on
Jan 16, 1996
Sold by
Zaray Ihsan Ullah and Zaray Sajiahj
Bought by
Zaray Shukriah and Zaray Khalil
Home Financials for this Owner
Home Financials are based on the most recent Mortgage that was taken out on this home.
Original Mortgage
$197,600
Outstanding Balance
$5,275
Interest Rate
7.18%
Estimated Equity
$2,397,557
Purchase Details
Closed on
May 3, 1994
Sold by
Peoples Security Life Insurance Corp
Bought by
Zaray Ihsan Ullah and Zaray Sajiah
Home Financials for this Owner
Home Financials are based on the most recent Mortgage that was taken out on this home.
Original Mortgage
$200,000
Interest Rate
7.84%
Create a Home Valuation Report for This Property
The Home Valuation Report is an in-depth analysis detailing your home's value as well as a comparison with similar homes in the area
Home Values in the Area
Average Home Value in this Area
Purchase History
| Date | Buyer | Sale Price | Title Company |
|---|---|---|---|
| Zaray Sajiah | -- | -- | |
| Zaray Shukriah | -- | American Title Ins Co | |
| Zaray Ihsan Ullah | $290,000 | Santa Clara Land Title Compa |
Source: Public Records
Mortgage History
| Date | Status | Borrower | Loan Amount |
|---|---|---|---|
| Open | Zaray Shukriah | $197,600 | |
| Closed | Zaray Ihsan Ullah | $200,000 |
Source: Public Records
Tax History Compared to Growth
Tax History
| Year | Tax Paid | Tax Assessment Tax Assessment Total Assessment is a certain percentage of the fair market value that is determined by local assessors to be the total taxable value of land and additions on the property. | Land | Improvement |
|---|---|---|---|---|
| 2025 | $5,713 | $492,884 | $254,937 | $237,947 |
| 2024 | $5,713 | $483,221 | $249,939 | $233,282 |
| 2023 | $5,693 | $473,747 | $245,039 | $228,708 |
| 2022 | $5,671 | $464,459 | $240,235 | $224,224 |
| 2021 | $5,587 | $455,353 | $235,525 | $219,828 |
| 2020 | $5,490 | $450,684 | $233,110 | $217,574 |
| 2019 | $5,428 | $441,848 | $228,540 | $213,308 |
| 2018 | $5,158 | $433,185 | $224,059 | $209,126 |
| 2017 | $5,091 | $424,692 | $219,666 | $205,026 |
| 2016 | $4,883 | $416,365 | $215,359 | $201,006 |
| 2015 | $4,833 | $410,112 | $212,125 | $197,987 |
| 2014 | $4,695 | $402,079 | $207,970 | $194,109 |
Source: Public Records
Map
Nearby Homes
- 1084 N Hillview Dr
- 773 Heflin St
- 1000 Jacklin Rd
- 182 Rose Dr
- 1830 Vegas Ave
- 474 Oliver St
- 391 Gross St
- 1339 Terra Vista Ct
- 99 Jacklin Ct
- 49100 Tomahawk Place
- 800 Los Positos Dr
- 60 Wilson Way Unit 171
- 60 Wilson Way Unit 150
- 60 Wilson Way Unit 158
- 49002 Cinnamon Fern Common Unit 311
- 521 Topham Ct
- 392 Terra Mesa Way
- 253 Park Hill Dr
- 559 Bayview Park Dr
- 1200 N Abbott Ave Unit 200
- 1445 N Hillview Dr
- 1431 N Hillview Dr
- 1381 Columbus Cir
- 1450 N Hillview Dr
- 1462 N Hillview Dr
- 1371 Columbus Cir
- 1438 N Hillview Dr
- 1397 N Hillview Dr
- 1474 N Hillview Dr
- 1426 N Hillview Dr
- 1486 N Hillview Dr
- 1374 Columbus Cir
- 1414 N Hillview Dr
- 1389 N Hillview Dr Unit 2
- 1363 Columbus Cir
- 1402 N Hillview Dr
- 1366 Columbus Cir
- 1498 N Hillview Dr
- 1381 N Hillview Dr
- 1353 Columbus Cir