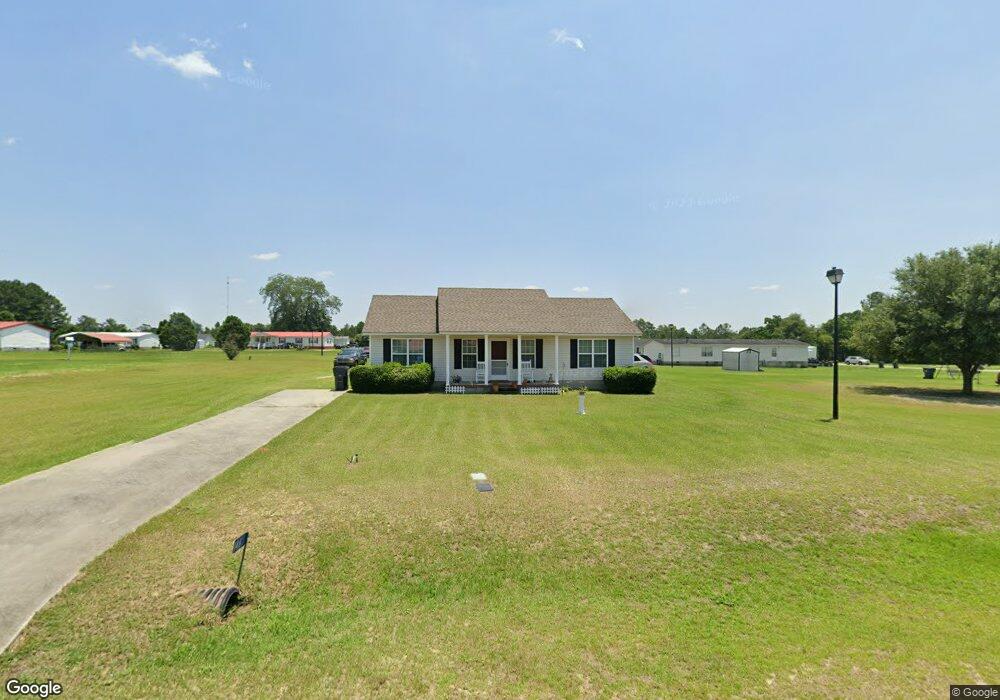
146 Charlie Lee Cir Cordele, GA 31015
Estimated Value: $134,630 - $182,000
3
Beds
2
Baths
1,215
Sq Ft
$133/Sq Ft
Est. Value
About This Home
This home is located at 146 Charlie Lee Cir, Cordele, GA 31015 and is currently estimated at $161,158, approximately $132 per square foot. 146 Charlie Lee Cir is a home located in Crisp County with nearby schools including Crisp County Elementary School, Crisp County Primary School, and Crisp County Middle School.
Ownership History
Date
Name
Owned For
Owner Type
Purchase Details
Closed on
Aug 17, 2020
Sold by
Cravey Richard E
Bought by
Liptroth Ella Mae
Current Estimated Value
Home Financials for this Owner
Home Financials are based on the most recent Mortgage that was taken out on this home.
Original Mortgage
$93,300
Outstanding Balance
$83,758
Interest Rate
2.9%
Mortgage Type
New Conventional
Estimated Equity
$77,400
Purchase Details
Closed on
May 22, 2008
Sold by
Avelo Mortgage Llc
Bought by
Cravey Richard E
Purchase Details
Closed on
Nov 6, 2007
Sold by
Feagen Tren
Bought by
Avelo Mtg Llc
Purchase Details
Closed on
Jun 16, 2006
Sold by
Southern Pines Subdivision
Bought by
Feagen Tren
Home Financials for this Owner
Home Financials are based on the most recent Mortgage that was taken out on this home.
Original Mortgage
$100,000
Interest Rate
11.4%
Mortgage Type
New Conventional
Purchase Details
Closed on
Feb 24, 2006
Sold by
Pate John S
Bought by
Southern Pines Subdivision Llc
Create a Home Valuation Report for This Property
The Home Valuation Report is an in-depth analysis detailing your home's value as well as a comparison with similar homes in the area
Home Values in the Area
Average Home Value in this Area
Purchase History
| Date | Buyer | Sale Price | Title Company |
|---|---|---|---|
| Liptroth Ella Mae | $89,796 | -- | |
| Cravey Richard E | $58,000 | -- | |
| Avelo Mtg Llc | $79,900 | -- | |
| Feagen Tren | $100,000 | -- | |
| Southern Pines Subdivision Llc | -- | -- |
Source: Public Records
Mortgage History
| Date | Status | Borrower | Loan Amount |
|---|---|---|---|
| Open | Liptroth Ella Mae | $93,300 | |
| Previous Owner | Feagen Tren | $100,000 |
Source: Public Records
Tax History Compared to Growth
Tax History
| Year | Tax Paid | Tax Assessment Tax Assessment Total Assessment is a certain percentage of the fair market value that is determined by local assessors to be the total taxable value of land and additions on the property. | Land | Improvement |
|---|---|---|---|---|
| 2024 | $1,122 | $41,425 | $2,800 | $38,625 |
| 2023 | $1,101 | $39,198 | $2,800 | $36,398 |
| 2022 | $1,038 | $36,945 | $2,800 | $34,145 |
| 2021 | $1,029 | $34,693 | $2,800 | $31,893 |
| 2020 | $1,011 | $34,031 | $2,800 | $31,231 |
| 2019 | $1,004 | $34,031 | $2,800 | $31,231 |
| 2018 | $1,041 | $34,000 | $2,800 | $31,200 |
| 2017 | $1,046 | $34,000 | $2,800 | $31,200 |
| 2016 | $1,044 | $34,000 | $2,800 | $31,200 |
| 2015 | -- | $34,000 | $2,800 | $31,200 |
| 2014 | -- | $34,000 | $2,800 | $31,200 |
| 2013 | -- | $33,999 | $2,800 | $31,199 |
Source: Public Records
Map
Nearby Homes
- 118 Joe Wright Drive New Harvest Rd
- 118 Joe Wright Dr
- TBD Aberdeen Circle Lt# 28
- 112 Judy Ave
- 141 Ruby St
- 2298 U S 41
- 0 S Byrd Mill Rd Unit 59577
- 0 S Byrd Mill Rd Unit 10608406
- 1506 S Joe Wright Dr
- 1606 S 5th St
- 2115 Royal Rd
- 615 E 28th Ave
- 618 E 27th Ave
- 607 E 27th Ave
- 510 E 25th Ave
- 619 E 26th Ave
- 724 E 26th Ave
- 1022 E 29th Ave
- 157 Bobwhite Dr
- 616 E 23rd Ave
- 114 Charlie Lee Cir
- 114 Charlie Lee Cir Unit A
- 140 Charlie Lee Cir
- 0 Charlie Lee Cir Unit 8600369
- 0 Charlie Lee Cir
- 152 Charlie Lee Cir
- 120 Charlie Lee Cir
- 147 Charlie Lee Cir
- 158 Charlie Lee Cir
- 115 Charlie Lee Cir
- 121 Charlie Lee Cir
- 127 Charlie Lee Cir
- 2282 Culpepper Rd
- 118 New Harvest Rd
- 2288 Culpepper Rd
- 2266 Culpepper Rd
- 2300 Culpepper Rd
- 2306 Culpepper Rd
- TBD SE Corner of Greer St North and 13th Ave E
- 000 N Cedar Creek Rd