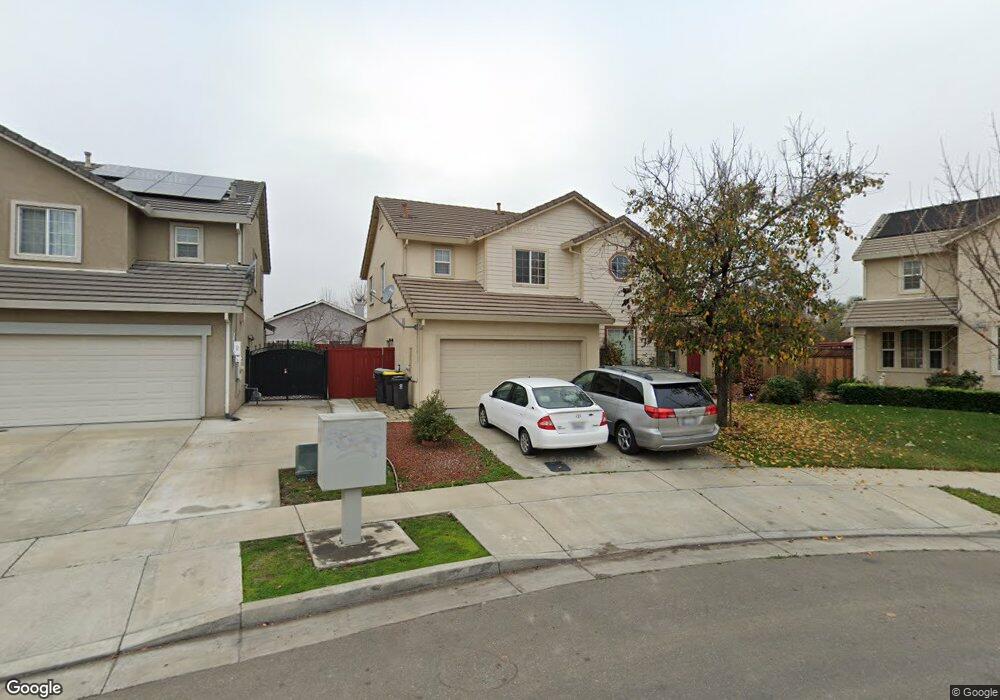
1461 Donati Cir Stockton, CA 95206
Seaport NeighborhoodEstimated Value: $439,000 - $542,000
4
Beds
2
Baths
2,303
Sq Ft
$211/Sq Ft
Est. Value
About This Home
This home is located at 1461 Donati Cir, Stockton, CA 95206 and is currently estimated at $486,309, approximately $211 per square foot. 1461 Donati Cir is a home located in San Joaquin County with nearby schools including Taylor Leadership Academy, San Joaquin Elementary School, and John Marshall Elementary School.
Ownership History
Date
Name
Owned For
Owner Type
Purchase Details
Closed on
Jun 25, 2021
Sold by
Galindo Olimpia T
Bought by
Galindo Olimpia T and Galindo Ricardo Ivan
Current Estimated Value
Purchase Details
Closed on
Feb 11, 2009
Sold by
Fdic
Bought by
Galindo Olimpia T
Home Financials for this Owner
Home Financials are based on the most recent Mortgage that was taken out on this home.
Original Mortgage
$112,500
Outstanding Balance
$71,455
Interest Rate
5.19%
Mortgage Type
Purchase Money Mortgage
Estimated Equity
$414,854
Purchase Details
Closed on
Aug 20, 2008
Sold by
Kemp Howard
Bought by
Indymac Bank Fsb
Purchase Details
Closed on
Jun 26, 2006
Sold by
Kemp Land Co
Bought by
Kemp Howard
Purchase Details
Closed on
Jun 23, 2006
Sold by
Kemp Beverly R
Bought by
Kemp Howard
Purchase Details
Closed on
Feb 15, 2006
Sold by
Lever Estates Lp
Bought by
Kemp Land Co
Create a Home Valuation Report for This Property
The Home Valuation Report is an in-depth analysis detailing your home's value as well as a comparison with similar homes in the area
Home Values in the Area
Average Home Value in this Area
Purchase History
| Date | Buyer | Sale Price | Title Company |
|---|---|---|---|
| Galindo Olimpia T | -- | None Available | |
| Galindo Olimpia T | $125,000 | Chicago Title Company | |
| Indymac Bank Fsb | $193,031 | None Available | |
| Kemp Howard | -- | Financial Title Company | |
| Kemp Howard | -- | Financial Title Company | |
| Kemp Land Co | -- | None Available |
Source: Public Records
Mortgage History
| Date | Status | Borrower | Loan Amount |
|---|---|---|---|
| Open | Galindo Olimpia T | $112,500 |
Source: Public Records
Tax History Compared to Growth
Tax History
| Year | Tax Paid | Tax Assessment Tax Assessment Total Assessment is a certain percentage of the fair market value that is determined by local assessors to be the total taxable value of land and additions on the property. | Land | Improvement |
|---|---|---|---|---|
| 2025 | $2,059 | $160,956 | $39,915 | $121,041 |
| 2024 | $2,024 | $157,801 | $39,133 | $118,668 |
| 2023 | $1,977 | $154,708 | $38,366 | $116,342 |
| 2022 | $1,857 | $151,675 | $37,614 | $114,061 |
| 2021 | $1,788 | $148,702 | $36,877 | $111,825 |
| 2020 | $1,821 | $147,178 | $36,499 | $110,679 |
| 2019 | $1,813 | $144,293 | $35,784 | $108,509 |
| 2018 | $2,096 | $141,465 | $35,083 | $106,382 |
| 2017 | $1,935 | $138,693 | $34,396 | $104,297 |
| 2016 | $1,948 | $135,973 | $33,721 | $102,252 |
| 2014 | $1,854 | $131,310 | $32,565 | $98,745 |
Source: Public Records
Map
Nearby Homes
- 1409 Laguna Cir
- 1413 Laguna Cir
- 2650 S Fresno Ave
- 2128 Green River Ln
- 1823 Fort Hall Place
- 1156 Derrick Dr
- 2242 Port Trinity Cir
- 2050 Grey Stone Dr
- 864 W 5th St
- 663 Chicago Ave
- 2079 Gordon Verner Cir
- 3330 Konig Ct
- 3504 French Camp Turnpike
- 1890 Gordon Verner Cir
- 1526 Kimiyo St
- 509 Howard St
- 3412 Shogoro Ln
- 2215 Dune Place
- 426 Howard St
- 3745 Wild Rose Ln
- 1465 Donati Cir
- 1457 Donati Cir
- 2506 Dry Creek Way
- 2520 Dry Creek Way
- 2462 Dry Creek Way
- 2534 Dry Creek Way
- 1469 Donati Cir Unit Ci
- 1469 Donati Cir
- 1453 Donati Cir
- 2446 Dry Creek Way
- 2548 Dry Creek Way
- 1464 Donati Cir
- 1449 Donati Cir
- 1473 Donati Cir Unit Ci
- 1473 Donati Cir
- 1522 Laguna Cir
- 2430 Dry Creek Way
- 1526 Laguna Cir
- 2562 Dry Creek Way
- 9999 Lever Blvd