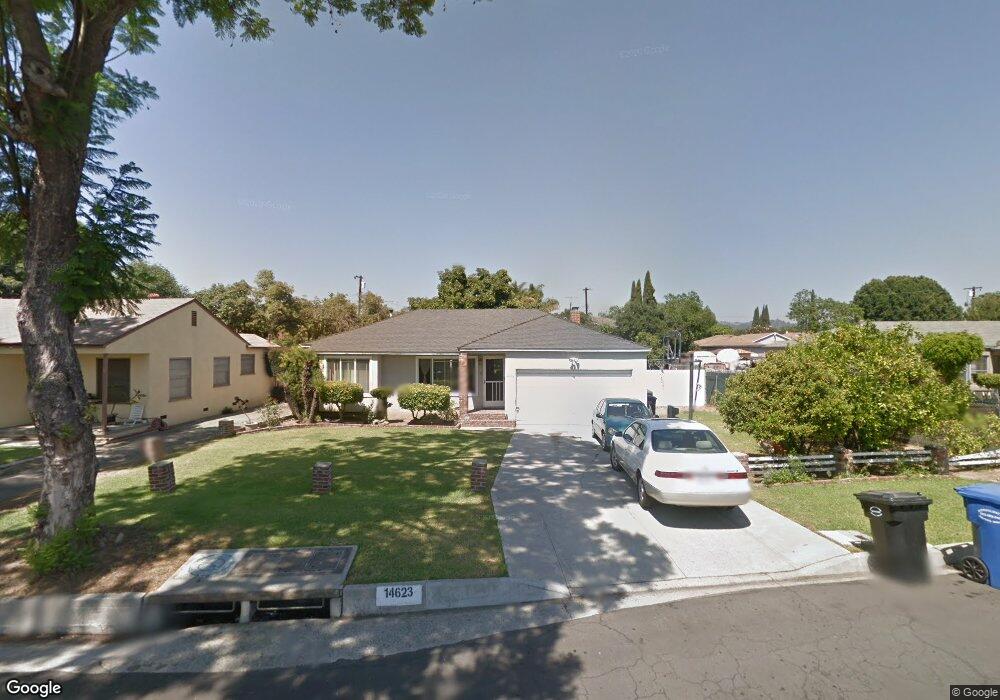
14623 Carnell St Whittier, CA 90603
South Whittier NeighborhoodEstimated Value: $821,000 - $888,619
3
Beds
2
Baths
1,557
Sq Ft
$546/Sq Ft
Est. Value
About This Home
This home is located at 14623 Carnell St, Whittier, CA 90603 and is currently estimated at $849,405, approximately $545 per square foot. 14623 Carnell St is a home located in Los Angeles County with nearby schools including Orchard Dale Elementary School, Hillview Middle School, and California High School.
Ownership History
Date
Name
Owned For
Owner Type
Purchase Details
Closed on
Aug 17, 1998
Sold by
Pelayo Carmen
Bought by
Luna Daniel and Luna Marie
Current Estimated Value
Home Financials for this Owner
Home Financials are based on the most recent Mortgage that was taken out on this home.
Original Mortgage
$117,000
Outstanding Balance
$24,323
Interest Rate
6.88%
Mortgage Type
Stand Alone First
Estimated Equity
$825,082
Purchase Details
Closed on
Aug 2, 1998
Sold by
Pelayo Juan
Bought by
Pelayo Carmen
Home Financials for this Owner
Home Financials are based on the most recent Mortgage that was taken out on this home.
Original Mortgage
$117,000
Outstanding Balance
$24,323
Interest Rate
6.88%
Mortgage Type
Stand Alone First
Estimated Equity
$825,082
Purchase Details
Closed on
Dec 13, 1996
Sold by
Trust Lee Leonard L And Ann L Trs Lee Fa
Bought by
Pelayo Juan and Pelayo Carmen
Home Financials for this Owner
Home Financials are based on the most recent Mortgage that was taken out on this home.
Original Mortgage
$163,850
Interest Rate
7.74%
Create a Home Valuation Report for This Property
The Home Valuation Report is an in-depth analysis detailing your home's value as well as a comparison with similar homes in the area
Home Values in the Area
Average Home Value in this Area
Purchase History
| Date | Buyer | Sale Price | Title Company |
|---|---|---|---|
| Luna Daniel | $180,000 | Landsafe Title Company | |
| Pelayo Carmen | -- | Landsafe Title | |
| Pelayo Juan | $172,500 | -- |
Source: Public Records
Mortgage History
| Date | Status | Borrower | Loan Amount |
|---|---|---|---|
| Open | Luna Daniel | $117,000 | |
| Previous Owner | Pelayo Juan | $163,850 |
Source: Public Records
Tax History
| Year | Tax Paid | Tax Assessment Tax Assessment Total Assessment is a certain percentage of the fair market value that is determined by local assessors to be the total taxable value of land and additions on the property. | Land | Improvement |
|---|---|---|---|---|
| 2025 | $3,874 | $282,163 | $156,288 | $125,875 |
| 2024 | $3,874 | $276,631 | $153,224 | $123,407 |
| 2023 | $3,874 | $271,208 | $150,220 | $120,988 |
| 2022 | $3,788 | $265,891 | $147,275 | $118,616 |
| 2021 | $3,673 | $260,679 | $144,388 | $116,291 |
| 2019 | $3,591 | $252,949 | $140,106 | $112,843 |
| 2018 | $3,366 | $247,990 | $137,359 | $110,631 |
| 2016 | $3,167 | $238,362 | $132,026 | $106,336 |
| 2015 | $3,157 | $234,782 | $130,043 | $104,739 |
| 2014 | $3,163 | $230,184 | $127,496 | $102,688 |
Source: Public Records
Map
Nearby Homes
- 14351 Starbuck St
- 10344 Parise Dr
- 14603 Christine Dr Unit 1
- 14215 La Forge St
- 10415 Valley View Ave
- 15043 Hayward St
- 8901 Ocean View Ave
- 8847 Ocean View Ave
- 14134 Putnam St
- 14548 Hawes St
- 14321 Christine Dr
- 14102 La Forge St
- 8646 Davista Dr
- 10405 Bluefield Ave
- 14723 Terryknoll Dr
- 14617 Montevideo Dr
- 14657 Via Pointe Del Sol
- 10241 Ruoff Ave
- 8459 La Vela Ave
- 14315 Broadway Unit 210
- 14615 Carnell St
- 14631 Carnell St
- 9312 Mills Ave
- 14609 Carnell St
- 14639 Carnell St
- 14604 Cullen St
- 14645 Carnell St
- 14630 Carnell St
- 14610 Cullen St
- 14585 Cedarsprings Dr
- 14622 Carnell St
- 14636 Carnell St
- 14616 Carnell St
- 14616 Cullen St
- 14651 Carnell St
- 9289 Mills Ave
- 9402 Mills Ave
- 0 Florence Ave & Inez St Unit MB23043120
- 9176 Hornby Ave
- 9339 Mills Ave
Your Personal Tour Guide
Ask me questions while you tour the home.