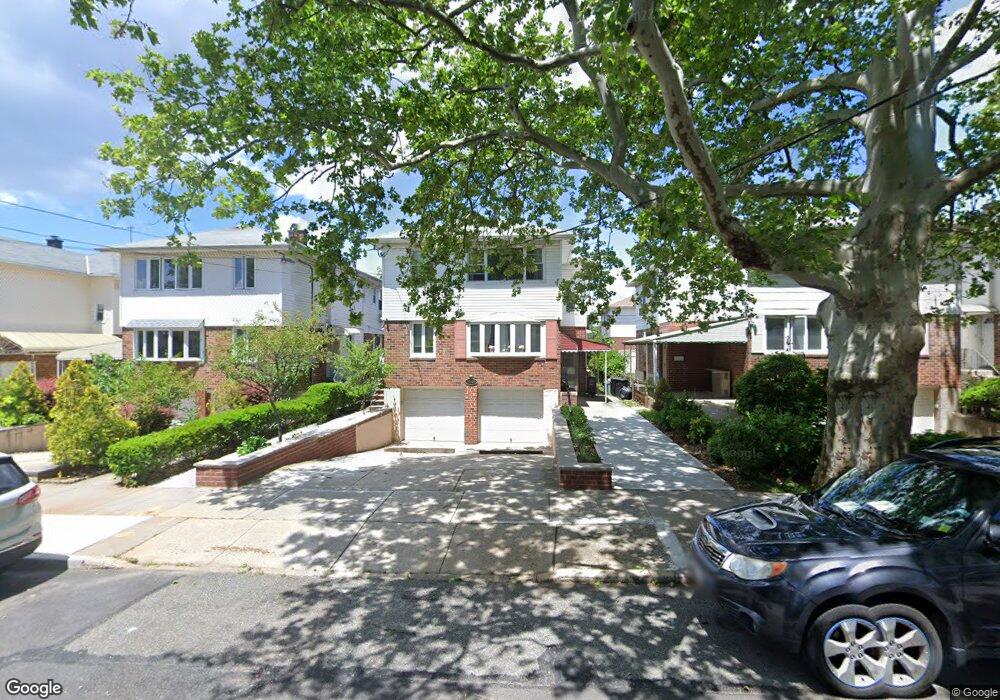
14629 26th Ave Flushing, NY 11354
Murray Hill-Broadway NeighborhoodEstimated Value: $1,241,364 - $1,747,000
Studio
5
Baths
2,140
Sq Ft
$750/Sq Ft
Est. Value
About This Home
This home is located at 14629 26th Ave, Flushing, NY 11354 and is currently estimated at $1,604,591, approximately $749 per square foot. 14629 26th Ave is a home located in Queens County with nearby schools including P.S. 21 Edward Hart, Jhs 185 Edward Bleeker, and Flushing High School.
Ownership History
Date
Name
Owned For
Owner Type
Purchase Details
Closed on
Jul 19, 2017
Sold by
Kwan C Kim Trustee and The Kim Family Trust Dated March 16 200
Bought by
Wang Baoxia and Wu Zhicheng
Current Estimated Value
Home Financials for this Owner
Home Financials are based on the most recent Mortgage that was taken out on this home.
Original Mortgage
$650,000
Outstanding Balance
$537,715
Interest Rate
3.91%
Mortgage Type
Purchase Money Mortgage
Estimated Equity
$1,066,876
Purchase Details
Closed on
Mar 25, 2005
Sold by
Kim Kwan C and Kim Tsai C
Bought by
Kwan C Kim and Kwan C Kim As Trustee Of The Kim Family
Purchase Details
Closed on
Oct 29, 1997
Sold by
Gams Morris and Gams Gloria
Bought by
Kim Kwan C and Kim Tsai C
Purchase Details
Closed on
Nov 7, 1994
Sold by
Ross Cheryl Marimow and Marimow William
Bought by
Ross Cheryl Marimow and Marimow Richard I
Create a Home Valuation Report for This Property
The Home Valuation Report is an in-depth analysis detailing your home's value as well as a comparison with similar homes in the area
Home Values in the Area
Average Home Value in this Area
Purchase History
| Date | Buyer | Sale Price | Title Company |
|---|---|---|---|
| Wang Baoxia | $1,293,000 | -- | |
| Wang Baoxia | $1,293,000 | -- | |
| Wang Baoxia | $1,293,000 | -- | |
| Kwan C Kim | -- | -- | |
| Kwan C Kim | -- | -- | |
| Kim Kwan C | $350,000 | Lawyers Title Insurance Corp | |
| Kim Kwan C | $350,000 | Lawyers Title Insurance Corp | |
| Ross Cheryl Marimow | -- | First American Title Ins Co | |
| Ross Cheryl Marimow | -- | First American Title Ins Co |
Source: Public Records
Mortgage History
| Date | Status | Borrower | Loan Amount |
|---|---|---|---|
| Open | Wang Baoxia | $650,000 | |
| Closed | Wang Baoxia | $650,000 |
Source: Public Records
Tax History
| Year | Tax Paid | Tax Assessment Tax Assessment Total Assessment is a certain percentage of the fair market value that is determined by local assessors to be the total taxable value of land and additions on the property. | Land | Improvement |
|---|---|---|---|---|
| 2025 | $13,919 | $71,663 | $18,757 | $52,906 |
| 2024 | $13,919 | $69,298 | $19,115 | $50,183 |
| 2023 | $13,131 | $65,376 | $18,272 | $47,104 |
| 2022 | $11,213 | $67,800 | $22,740 | $45,060 |
| 2021 | $11,144 | $71,340 | $22,740 | $48,600 |
| 2020 | $11,217 | $78,420 | $22,740 | $55,680 |
| 2019 | $10,657 | $77,400 | $22,740 | $54,660 |
| 2018 | $11,106 | $54,480 | $22,740 | $31,740 |
| 2017 | $9,166 | $52,750 | $22,363 | $30,387 |
| 2016 | $4,353 | $52,750 | $22,363 | $30,387 |
| 2015 | $2,562 | $49,766 | $21,622 | $28,144 |
| 2014 | $2,562 | $48,384 | $23,095 | $25,289 |
Source: Public Records
Map
Nearby Homes
- 14632 Willets Point Blvd
- 14445 25th Dr
- 14425 26th Ave
- 14718 24th Ave
- 145-17 Willets Point Blvd
- 142-15 26th Ave Unit 4D
- 14215 26th Ave Unit 5F
- 2704 Parsons Blvd Unit 6B
- 27-04 Parsons Blvd Unit 6
- 142-21 26th Ave Unit 4F
- 142-21 26th Ave Unit 6E
- 142-21 26th Ave Unit 1D
- 142-21 26th Ave Unit 1A
- 142-21 26th Ave Unit 5D
- 27-10 Parsons Blvd Unit 6H
- 25-11 Union St Unit 2A
- 26-21 Union St Unit 1B
- 145 E 29th St Unit 5A
- 23-38 144th St
- 25-47 150th St
- 14629 26th Ave
- 14629 26th Ave
- 14629 26th Ave
- 14627 26th Ave
- 14633 26th Ave Unit 2nd Fl
- 14633 26th Ave
- 14633 26th Ave
- 14623 26th Ave
- 14623 26th Ave Unit 2 Fl
- 14623 26th Ave
- 14637 26th Ave
- 146-37 26th Ave
- 14630 25th Dr
- 14630 25th Dr Unit 1Fl
- 14630 25th Dr
- 146-30 25th Dr
- 146-30 25th Dr Unit 2
- 14626 25th Dr
- 14634 25th Dr
- 14619 26th Ave
Your Personal Tour Guide
Ask me questions while you tour the home.