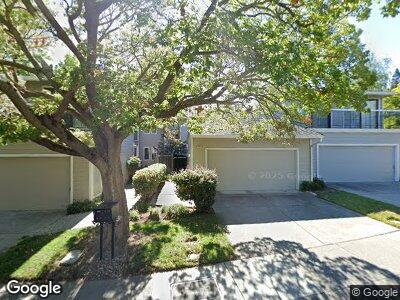
1463 Quail View Cir Walnut Creek, CA 94597
Estimated Value: $1,049,000 - $1,162,000
3
Beds
3
Baths
1,988
Sq Ft
$549/Sq Ft
Est. Value
About This Home
This home is located at 1463 Quail View Cir, Walnut Creek, CA 94597 and is currently estimated at $1,092,327, approximately $549 per square foot. 1463 Quail View Cir is a home located in Contra Costa County with nearby schools including Buena Vista Elementary School, Walnut Creek Intermediate School, and Las Lomas High School.
Ownership History
Date
Name
Owned For
Owner Type
Purchase Details
Closed on
Sep 10, 2009
Sold by
George Robert E
Bought by
The Robert E George Revocable Trust
Current Estimated Value
Purchase Details
Closed on
Oct 10, 2007
Sold by
George Robert E and George Marina
Bought by
George Robert E
Purchase Details
Closed on
Oct 14, 1998
Sold by
George Robert E and George Marina
Bought by
George Robert E and George Marina
Home Financials for this Owner
Home Financials are based on the most recent Mortgage that was taken out on this home.
Original Mortgage
$79,350
Outstanding Balance
$17,392
Interest Rate
6.79%
Mortgage Type
Purchase Money Mortgage
Estimated Equity
$1,070,567
Purchase Details
Closed on
Apr 27, 1994
Sold by
George Robert E and George Marina R
Bought by
George Robert E and George Marina
Create a Home Valuation Report for This Property
The Home Valuation Report is an in-depth analysis detailing your home's value as well as a comparison with similar homes in the area
Home Values in the Area
Average Home Value in this Area
Purchase History
| Date | Buyer | Sale Price | Title Company |
|---|---|---|---|
| The Robert E George Revocable Trust | -- | None Available | |
| George Robert E | -- | None Available | |
| George Robert E | -- | Old Republic Title Company | |
| George Robert E | -- | Old Republic Title Company | |
| George Robert E | -- | -- |
Source: Public Records
Mortgage History
| Date | Status | Borrower | Loan Amount |
|---|---|---|---|
| Open | George Robert E | $79,350 |
Source: Public Records
Tax History Compared to Growth
Tax History
| Year | Tax Paid | Tax Assessment Tax Assessment Total Assessment is a certain percentage of the fair market value that is determined by local assessors to be the total taxable value of land and additions on the property. | Land | Improvement |
|---|---|---|---|---|
| 2024 | $6,104 | $469,119 | $132,449 | $336,670 |
| 2023 | $6,104 | $459,921 | $129,852 | $330,069 |
| 2022 | $5,979 | $450,904 | $127,306 | $323,598 |
| 2021 | $5,816 | $442,063 | $124,810 | $317,253 |
| 2019 | $5,674 | $428,953 | $121,109 | $307,844 |
| 2018 | $5,483 | $420,543 | $118,735 | $301,808 |
| 2017 | $5,371 | $412,298 | $116,407 | $295,891 |
| 2016 | $5,259 | $404,215 | $114,125 | $290,090 |
| 2015 | $5,133 | $398,144 | $112,411 | $285,733 |
| 2014 | $5,061 | $390,346 | $110,210 | $280,136 |
Source: Public Records
Map
Nearby Homes
- 1425 Camino Verde
- 1430 Piedra Dr
- 1431 Huston Rd
- 2371 Mallard Dr
- 1769 Holland Cir
- 1800 Cannon Dr
- 1925 Aspenridge Ct
- 2515 Larkey Ln
- 2660 Ross Place
- 1516 Pleasant Hill Rd
- 1536 Pleasant Hill Rd
- 911 Sousa Dr
- 111 Hilltop Crescent
- 2180 Geary Rd Unit 2
- 3231 Quandt Rd
- 117 Miramonte Rd
- 76 Terrace Rd
- 1375 Reliez Valley Rd
- 3273 Wooded Creek Ln
- 1592 Springbrook Rd
- 1463 Quail View Cir
- 1461 Quail View Cir
- 1471 Quail View Cir
- 1445 Quail View Cir
- 1473 Quail View Cir
- 1443 Quail View Cir
- 1475 Quail View Cir
- 1468 Quail View Cir
- 1302 Ramsay Cir
- 1429 Quail View Cir
- 1477 Quail View Cir
- 1427 Quail View Cir
- 1479 Quail View Cir
- 1452 Quail View Cir
- 1450 Quail View Cir
- 1476 Quail View Cir
- 1448 Quail View Cir
- 1446 Quail View Cir
- 1481 Quail View Cir
- 1306 Ramsay Cir