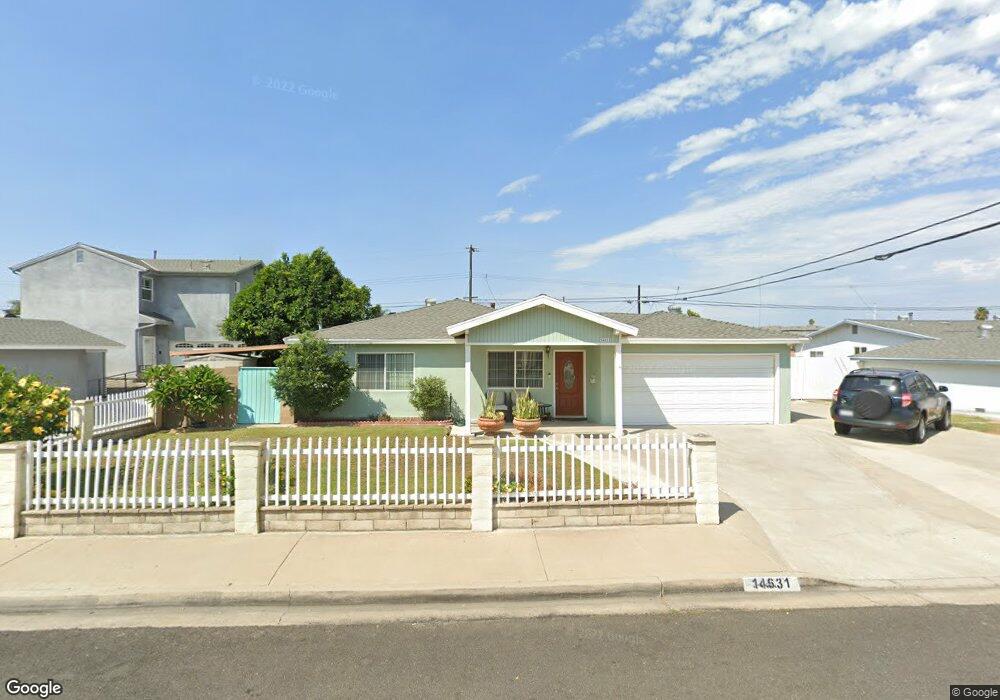
14631 Riata St Midway City, CA 92655
Little Saigon NeighborhoodEstimated Value: $1,048,186 - $1,404,000
4
Beds
2
Baths
1,290
Sq Ft
$933/Sq Ft
Est. Value
About This Home
This home is located at 14631 Riata St, Midway City, CA 92655 and is currently estimated at $1,203,797, approximately $933 per square foot. 14631 Riata St is a home located in Orange County with nearby schools including Hayden Elementary School, Warner Middle, and Westminster High School.
Ownership History
Date
Name
Owned For
Owner Type
Purchase Details
Closed on
Sep 9, 2005
Sold by
Nguyen Peter and Nguyen Thu Huyen Thi
Bought by
Nguyen Thu Huyen Thi
Current Estimated Value
Home Financials for this Owner
Home Financials are based on the most recent Mortgage that was taken out on this home.
Original Mortgage
$350,000
Interest Rate
5.76%
Mortgage Type
New Conventional
Purchase Details
Closed on
Aug 2, 2005
Sold by
Nguyen Ly Sang Thi
Bought by
Nguyen Peter
Home Financials for this Owner
Home Financials are based on the most recent Mortgage that was taken out on this home.
Original Mortgage
$350,000
Interest Rate
5.76%
Mortgage Type
New Conventional
Purchase Details
Closed on
Sep 4, 2002
Sold by
Nguyen Ly Sanh Thi
Bought by
Nguyen Peter
Home Financials for this Owner
Home Financials are based on the most recent Mortgage that was taken out on this home.
Original Mortgage
$200,000
Interest Rate
6.37%
Purchase Details
Closed on
Jan 19, 2001
Sold by
Nguyen Ly Sanh Thi
Bought by
Nguyen Peter
Create a Home Valuation Report for This Property
The Home Valuation Report is an in-depth analysis detailing your home's value as well as a comparison with similar homes in the area
Home Values in the Area
Average Home Value in this Area
Purchase History
| Date | Buyer | Sale Price | Title Company |
|---|---|---|---|
| Nguyen Thu Huyen Thi | -- | Fidelity National Title Co | |
| Nguyen Peter | -- | -- | |
| Nguyen Peter | -- | -- | |
| Nguyen Peter | -- | Lawyers Title Company | |
| Nguyen Peter | -- | -- |
Source: Public Records
Mortgage History
| Date | Status | Borrower | Loan Amount |
|---|---|---|---|
| Closed | Nguyen Thu Huyen Thi | $350,000 | |
| Closed | Nguyen Peter | $200,000 |
Source: Public Records
Tax History Compared to Growth
Tax History
| Year | Tax Paid | Tax Assessment Tax Assessment Total Assessment is a certain percentage of the fair market value that is determined by local assessors to be the total taxable value of land and additions on the property. | Land | Improvement |
|---|---|---|---|---|
| 2025 | $9,107 | $778,944 | $703,637 | $75,307 |
| 2024 | $9,107 | $763,671 | $689,840 | $73,831 |
| 2023 | $8,797 | $748,698 | $676,314 | $72,384 |
| 2022 | $8,665 | $734,018 | $663,053 | $70,965 |
| 2021 | $8,458 | $719,626 | $650,052 | $69,574 |
| 2020 | $7,403 | $625,260 | $567,920 | $57,340 |
| 2019 | $7,319 | $613,000 | $556,784 | $56,216 |
| 2018 | $7,454 | $613,000 | $556,784 | $56,216 |
| 2017 | $7,303 | $613,000 | $556,784 | $56,216 |
| 2016 | $6,647 | $562,000 | $505,784 | $56,216 |
| 2015 | $5,640 | $471,244 | $415,028 | $56,216 |
| 2014 | $5,615 | $471,244 | $415,028 | $56,216 |
Source: Public Records
Map
Nearby Homes
- 14712 Newland St
- 14721 Riata St
- 14572 Purdy St
- 14702 Purdy St
- 14892 Valencia Plaza
- 8741 Jennrich Ave
- 8862 Ovieda Plaza
- 14352 Beach Blvd Unit 41
- 8200 Bolsa Ave Unit 42
- 15081 Van Buren St
- 8866 Grandville Cir
- 14972 Beach Blvd
- 9132 Hazard Ave
- 14342 Tilden St
- 8331 Gumwood Cir
- 15110 Henley Dr Unit 51
- 8206 Maureen Dr Unit 16
- 8192 18th St
- 8196 18th St
- 7026 Solara Way
- 14611 Riata St
- 14641 Riata St
- 14632 Newland St
- 14642 Newland St
- 14612 Newland St
- 14601 Riata St
- 14642 Riata St
- 14651 Riata St
- 14622 Riata St
- 14652 Newland St
- 8571 Roosevelt Ave
- 14592 Newland St
- 14591 Riata St
- 14661 Riata St
- 8572 Bird Ave
- 14662 Newland St
- 14662 Riata St
- 8581 Roosevelt Ave
- 14582 Newland St
- 14581 Riata St