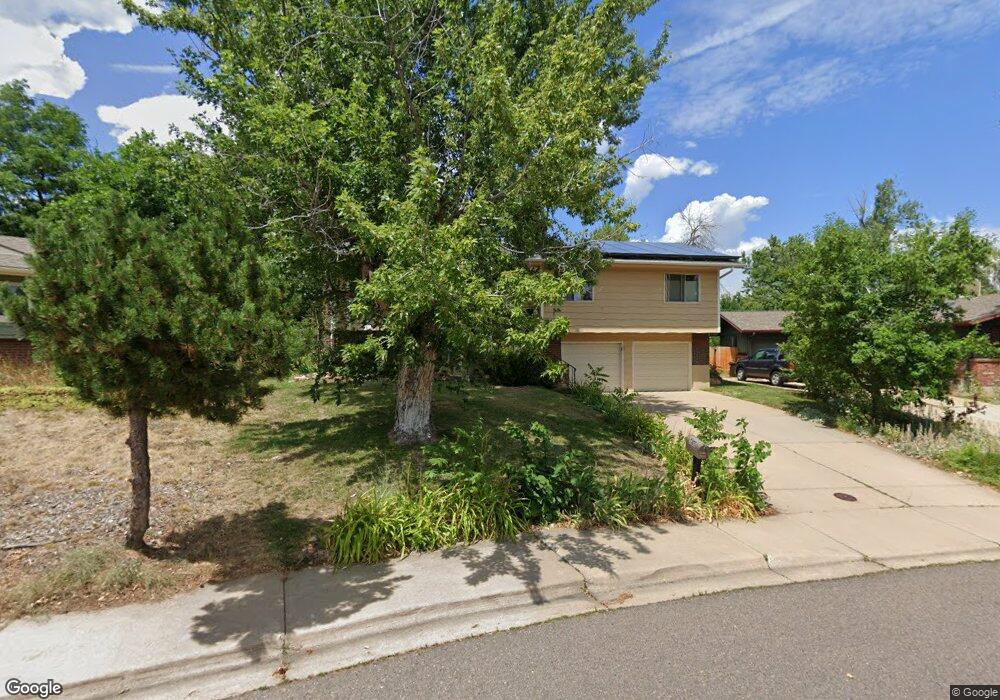
1465 Judson Dr Boulder, CO 80305
Table Mesa NeighborhoodEstimated Value: $1,320,279 - $1,422,000
4
Beds
3
Baths
1,800
Sq Ft
$766/Sq Ft
Est. Value
About This Home
This home is located at 1465 Judson Dr, Boulder, CO 80305 and is currently estimated at $1,378,070, approximately $765 per square foot. 1465 Judson Dr is a home located in Boulder County with nearby schools including Mesa Elementary School, Southern Hills Middle School, and Fairview High School.
Ownership History
Date
Name
Owned For
Owner Type
Purchase Details
Closed on
Oct 22, 2009
Sold by
Stevenson Patricia
Bought by
Dixon Michael J
Current Estimated Value
Home Financials for this Owner
Home Financials are based on the most recent Mortgage that was taken out on this home.
Original Mortgage
$150,000
Interest Rate
4.56%
Mortgage Type
New Conventional
Purchase Details
Closed on
Apr 27, 2007
Sold by
Raizman Marc and Raizman Marjorie B
Bought by
Stevenson Patricia
Home Financials for this Owner
Home Financials are based on the most recent Mortgage that was taken out on this home.
Original Mortgage
$417,000
Interest Rate
5.87%
Mortgage Type
Purchase Money Mortgage
Purchase Details
Closed on
Apr 2, 1998
Sold by
Raizman Marc and Raizman Marjorie B
Bought by
Raizman Marc
Purchase Details
Closed on
Aug 29, 1978
Bought by
Dixon Michael J
Create a Home Valuation Report for This Property
The Home Valuation Report is an in-depth analysis detailing your home's value as well as a comparison with similar homes in the area
Home Values in the Area
Average Home Value in this Area
Purchase History
| Date | Buyer | Sale Price | Title Company |
|---|---|---|---|
| Dixon Michael J | $616,500 | Heritage Title | |
| Stevenson Patricia | $550,500 | Utc Colorado | |
| Raizman Marc | -- | -- | |
| Dixon Michael J | $74,500 | -- |
Source: Public Records
Mortgage History
| Date | Status | Borrower | Loan Amount |
|---|---|---|---|
| Previous Owner | Dixon Michael J | $150,000 | |
| Previous Owner | Stevenson Patricia | $417,000 |
Source: Public Records
Tax History Compared to Growth
Tax History
| Year | Tax Paid | Tax Assessment Tax Assessment Total Assessment is a certain percentage of the fair market value that is determined by local assessors to be the total taxable value of land and additions on the property. | Land | Improvement |
|---|---|---|---|---|
| 2025 | $7,695 | $81,531 | $64,625 | $16,906 |
| 2024 | $7,695 | $81,531 | $64,625 | $16,906 |
| 2023 | $7,562 | $87,562 | $74,169 | $17,078 |
| 2022 | $6,649 | $71,599 | $54,558 | $17,041 |
| 2021 | $6,340 | $73,660 | $56,128 | $17,532 |
| 2020 | $5,508 | $63,278 | $50,622 | $12,656 |
| 2019 | $5,424 | $63,278 | $50,622 | $12,656 |
| 2018 | $5,174 | $59,681 | $36,432 | $23,249 |
| 2017 | $5,012 | $65,981 | $40,278 | $25,703 |
| 2016 | $4,887 | $56,460 | $32,397 | $24,063 |
| 2015 | $4,628 | $44,711 | $20,218 | $24,493 |
| 2014 | $3,759 | $44,711 | $20,218 | $24,493 |
Source: Public Records
Map
Nearby Homes
- 1535 Findlay Way
- 2880 La Grange Cir
- 3310 Heidelberg Dr
- 2665 Juilliard St
- 3410 Heidelberg Dr
- 3450 Emerson Ave
- 1120 Hartford Dr
- 1395 Drexel St
- 2581 Briarwood Dr
- 2860 Table Mesa Dr
- 3394 Cripple Creek Trail Unit H15
- 3387 Cripple Creek Trail Unit F14
- 3391 Cripple Creek Trail Unit E
- 3433 Cripple Creek Square Unit G16
- 3630 Silver Plume Ln
- 3970 Longwood Ave
- 3196 Galena Way
- 4350 Butler Cir
- 960 Toedtli Dr
- 4204 Greenbriar Blvd Unit 45
- 1455 Judson Dr
- 1475 Judson Dr
- 1480 Kendall Dr
- 1490 Kendall Dr
- 1470 Kendall Dr
- 1445 Judson Dr
- 1495 Judson Dr
- 1450 Kendall Dr
- 1480 Judson Dr
- 1440 Kendall Dr
- 1510 Kendall Dr
- 1430 Kendall Dr
- 1460 Kendall Dr
- 1490 Judson Dr
- 1505 Judson Dr
- 1435 Judson Dr
- 1520 Kendall Dr
- 1420 Kendall Dr
- 1476 Judson Dr
- 1485 Kendall Dr