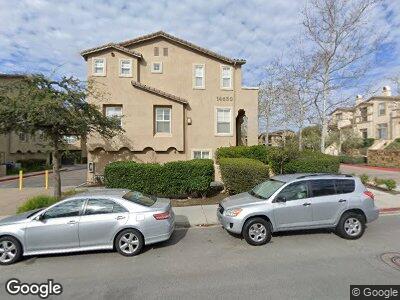
14650 Via Fiesta Unit 2 San Diego, CA 92127
Black Mountain Ranch NeighborhoodEstimated Value: $349,000 - $792,191
3
Beds
3
Baths
1,444
Sq Ft
$441/Sq Ft
Est. Value
About This Home
This home is located at 14650 Via Fiesta Unit 2, San Diego, CA 92127 and is currently estimated at $636,298, approximately $440 per square foot. 14650 Via Fiesta Unit 2 is a home located in San Diego County with nearby schools including Willow Grove Elementary School, Black Mountain Middle School, and Del Norte High School.
Ownership History
Date
Name
Owned For
Owner Type
Purchase Details
Closed on
Feb 16, 2022
Sold by
Oscar And Divina Jaurigue Family Trust
Bought by
Divinia R Jaurigue 2022 Living
Current Estimated Value
Purchase Details
Closed on
Dec 13, 2011
Sold by
Jaurigue Oscar L and Jaurigue Divinia R
Bought by
Jaurigue Oscar L and Jaurigue Divinia R
Home Financials for this Owner
Home Financials are based on the most recent Mortgage that was taken out on this home.
Original Mortgage
$140,700
Interest Rate
3.27%
Mortgage Type
New Conventional
Purchase Details
Closed on
Feb 19, 2005
Sold by
Jaurigue Oscar L and Jaurigue Divinia R
Bought by
Jaurigue Oscar L and Jaurigue Divinia R
Purchase Details
Closed on
Nov 21, 2003
Sold by
Olson San Diego 120 Llc
Bought by
Jaurigue Oscar L and Jaurigue Divinia R
Home Financials for this Owner
Home Financials are based on the most recent Mortgage that was taken out on this home.
Original Mortgage
$264,700
Interest Rate
5.38%
Mortgage Type
Purchase Money Mortgage
Create a Home Valuation Report for This Property
The Home Valuation Report is an in-depth analysis detailing your home's value as well as a comparison with similar homes in the area
Home Values in the Area
Average Home Value in this Area
Purchase History
| Date | Buyer | Sale Price | Title Company |
|---|---|---|---|
| Divinia R Jaurigue 2022 Living | -- | Littorno Richard Arthur | |
| Jaurigue Oscar L | -- | Tsi | |
| Jaurigue Oscar L | -- | Tsi | |
| Jaurigue Oscar L | -- | -- | |
| Jaurigue Oscar L | -- | -- | |
| Jaurigue Oscar L | $331,000 | Commonwealth Land Title Co |
Source: Public Records
Mortgage History
| Date | Status | Borrower | Loan Amount |
|---|---|---|---|
| Previous Owner | Jaurigue Oscar L | $140,700 | |
| Previous Owner | Jaurigue Oscar L | $264,700 |
Source: Public Records
Tax History Compared to Growth
Tax History
| Year | Tax Paid | Tax Assessment Tax Assessment Total Assessment is a certain percentage of the fair market value that is determined by local assessors to be the total taxable value of land and additions on the property. | Land | Improvement |
|---|---|---|---|---|
| 2024 | $5,603 | $386,641 | $109,567 | $277,074 |
| 2023 | $5,531 | $379,061 | $107,419 | $271,642 |
| 2022 | $5,510 | $371,629 | $105,313 | $266,316 |
| 2021 | $5,618 | $364,344 | $103,249 | $261,095 |
| 2020 | $5,593 | $360,609 | $102,191 | $258,418 |
| 2019 | $5,514 | $353,539 | $100,188 | $253,351 |
| 2018 | $5,430 | $346,608 | $98,224 | $248,384 |
| 2017 | $5,374 | $339,813 | $96,299 | $243,514 |
| 2016 | $5,288 | $333,151 | $94,411 | $238,740 |
| 2015 | $5,199 | $328,147 | $92,993 | $235,154 |
| 2014 | $5,069 | $321,720 | $91,172 | $230,548 |
Source: Public Records
Map
Nearby Homes
- 14658 Via Fiesta Unit 3
- 14640 Via Bergamo
- 7557 Crescendo Ln
- 7725 Cantata Ln
- 14523 Caminito Lazanja
- 7718 Via Vivaldi
- 14510 Camino de la Luna Unit 4
- 14662 Encendido
- 14420 Rancho Del Prado Trail
- 14675 Plein Aire Ct
- 6868 Spyglass Ln
- 0 Spyglass Ln Unit 42 250018397
- 7930 Entrada Lazanja
- 7630 Iluminado
- 17381 Circa Oriente
- 17176 Calle Serena
- 7845 Caminito Camelia
- 17515 Circa Oriente
- 14869 Calle Montelibano
- 17135 Circa Del Sur
- 14656 Via Fiesta Unit 1
- 14656 Via Fiesta Unit 2
- 14656 Via Fiesta Unit 5
- 14690 Via Fiesta Unit 1
- 14656 Via Fiesta Unit 4
- 14654 Via Fiesta Unit 1
- 14654 Via Fiesta Unit 2
- 14654 Via Fiesta Unit 3
- 14654 Via Fiesta Unit 4
- 14650 Via Fiesta Unit 1
- 14650 Via Fiesta Unit 2
- 14650 Via Fiesta Unit 3
- 14650 Via Fiesta Unit 4
- 14690 Via Fiesta Unit 4
- 14690 Via Fiesta Unit 3
- 14690 Via Fiesta Unit 2
- 14656 Via Fiesta Unit 3
- 14682 Via Fiesta Unit 6
- 14682 Via Fiesta Unit 5
- 14682 Via Fiesta Unit 2