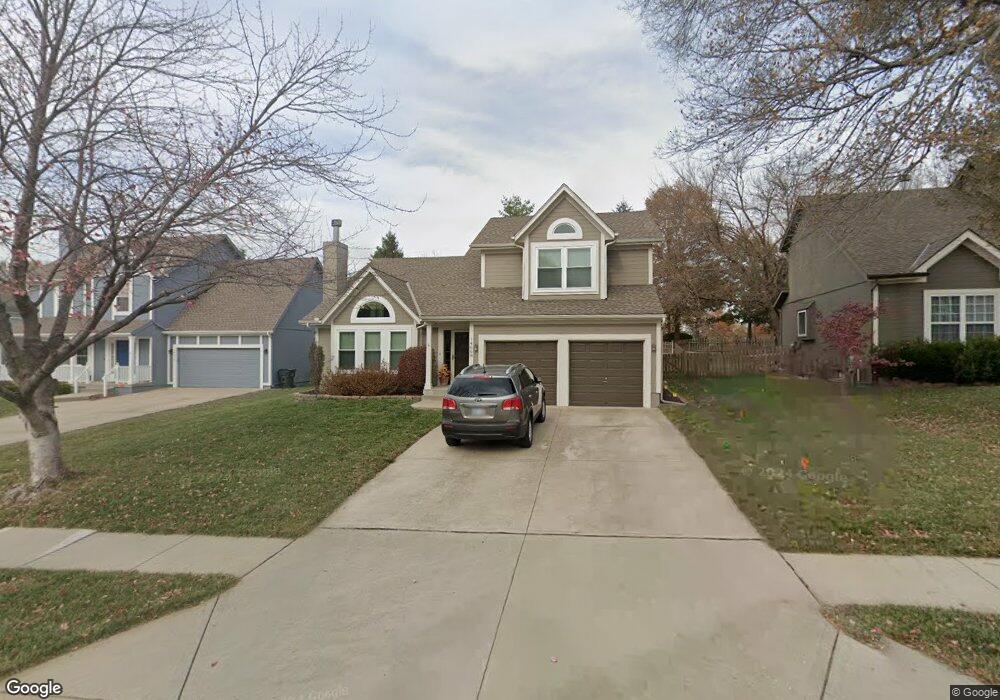
14668 W 151st Terrace Olathe, KS 66062
Estimated Value: $398,095 - $434,000
3
Beds
2
Baths
1,405
Sq Ft
$296/Sq Ft
Est. Value
About This Home
This home is located at 14668 W 151st Terrace, Olathe, KS 66062 and is currently estimated at $415,524, approximately $295 per square foot. 14668 W 151st Terrace is a home located in Johnson County with nearby schools including Arbor Creek Elementary School, Chisholm Trail Middle School, and Olathe South Sr High School.
Ownership History
Date
Name
Owned For
Owner Type
Purchase Details
Closed on
Aug 8, 2019
Sold by
Vohland Jennifer A
Bought by
Vohland Jennifer A and Vohland Revocable T Jennifer A
Current Estimated Value
Purchase Details
Closed on
Mar 23, 2010
Sold by
Heyka Scott J and Heyka Sarah A
Bought by
Vohland Kevin Patrick and Vohland Jennifer Ann
Home Financials for this Owner
Home Financials are based on the most recent Mortgage that was taken out on this home.
Original Mortgage
$190,000
Outstanding Balance
$125,802
Interest Rate
4.96%
Mortgage Type
New Conventional
Estimated Equity
$289,722
Purchase Details
Closed on
Feb 14, 2003
Sold by
White Brian C and White Kelly A
Bought by
Heyka Scott J and Heyka Sarah A
Home Financials for this Owner
Home Financials are based on the most recent Mortgage that was taken out on this home.
Original Mortgage
$163,400
Interest Rate
4.87%
Create a Home Valuation Report for This Property
The Home Valuation Report is an in-depth analysis detailing your home's value as well as a comparison with similar homes in the area
Home Values in the Area
Average Home Value in this Area
Purchase History
| Date | Buyer | Sale Price | Title Company |
|---|---|---|---|
| Vohland Jennifer A | -- | None Available | |
| Vohland Kevin Patrick | -- | Chicago Title Ins Co | |
| Heyka Scott J | -- | Security Land Title Company |
Source: Public Records
Mortgage History
| Date | Status | Borrower | Loan Amount |
|---|---|---|---|
| Open | Vohland Kevin Patrick | $190,000 | |
| Previous Owner | Heyka Scott J | $163,400 |
Source: Public Records
Tax History Compared to Growth
Tax History
| Year | Tax Paid | Tax Assessment Tax Assessment Total Assessment is a certain percentage of the fair market value that is determined by local assessors to be the total taxable value of land and additions on the property. | Land | Improvement |
|---|---|---|---|---|
| 2024 | $4,880 | $43,390 | $8,233 | $35,157 |
| 2023 | $4,602 | $40,158 | $6,860 | $33,298 |
| 2022 | $4,273 | $36,282 | $5,967 | $30,315 |
| 2021 | $4,163 | $33,672 | $5,967 | $27,705 |
| 2020 | $4,080 | $32,706 | $5,967 | $26,739 |
| 2019 | $3,660 | $29,175 | $5,469 | $23,706 |
| 2018 | $3,690 | $29,198 | $5,469 | $23,729 |
| 2017 | $3,347 | $26,243 | $4,759 | $21,484 |
| 2016 | $3,079 | $24,771 | $4,759 | $20,012 |
| 2015 | $2,955 | $23,794 | $4,759 | $19,035 |
| 2013 | -- | $22,310 | $4,759 | $17,551 |
Source: Public Records
Map
Nearby Homes
- 14296 W 153rd St
- 15478 S Acuff Ln
- 14165 W 149th Terrace
- 14990 W 154th St
- 14923 W Peppermill Dr
- 14031 W 152nd Terrace Unit 3703
- 15241 S Symphony Dr Unit 3402
- 15168 W 154th St
- 15221 W 153rd St
- 15375 W 147th Terrace
- 15643 W 149th Terrace
- 14889 S Gallery St
- 14650 S Alden St
- 0 133rd & S Blackfoot Dr Unit HMS2572444
- 14631 S Acuff Ln
- 14655 S Greenwood St
- 14611 S Acuff Ln
- 15343 S Navaho Dr
- 15028 W 146th Terrace
- 15101 W 146th Cir
- 14652 W 151st Terrace
- 14676 W 151st Terrace
- 14646 W 151st Terrace
- 14682 W 151st Terrace
- 14667 W 151st Terrace
- 14651 W 151st Terrace
- 14690 W 151st Terrace
- 14645 W 151st Terrace
- 14675 W 151st Terrace
- 14634 W 151st Terrace
- 14691 W 151st Terrace
- 14681 W 151st Terrace
- 14628 W 151st Terrace
- 14650 W 152nd St
- 14644 W 152nd St
- 14662 W 152nd St
- 14636 W 152nd St
- 14672 W 152nd St
- 14627 W 151st Terrace
- 14628 W 152nd St