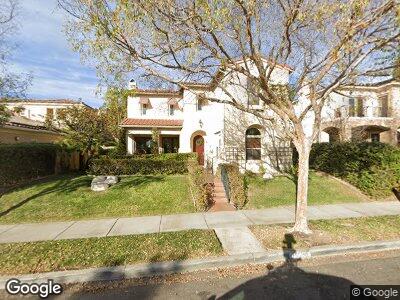
14686 Via Monteverde San Diego, CA 92127
Black Mountain Ranch NeighborhoodEstimated Value: $1,649,000 - $2,336,931
3
Beds
4
Baths
3,038
Sq Ft
$693/Sq Ft
Est. Value
About This Home
This home is located at 14686 Via Monteverde, San Diego, CA 92127 and is currently estimated at $2,105,733, approximately $693 per square foot. 14686 Via Monteverde is a home located in San Diego County with nearby schools including Willow Grove Elementary School, Black Mountain Middle School, and Del Norte High School.
Ownership History
Date
Name
Owned For
Owner Type
Purchase Details
Closed on
Sep 28, 2010
Sold by
Cornelius Michael C and Cornelius Michelle A
Bought by
Cornelius Michael C and Cornelius Michelle A
Current Estimated Value
Home Financials for this Owner
Home Financials are based on the most recent Mortgage that was taken out on this home.
Original Mortgage
$452,000
Interest Rate
4.27%
Mortgage Type
New Conventional
Purchase Details
Closed on
Jul 15, 2009
Sold by
Cornelius Michael C and Cornelius Michelle A
Bought by
Cornelius Michael C and Cornelius Michelle A
Purchase Details
Closed on
Jun 2, 2003
Sold by
Shea Homes Lp
Bought by
Cornelius Michael C and Cornelius Michelle A
Home Financials for this Owner
Home Financials are based on the most recent Mortgage that was taken out on this home.
Original Mortgage
$497,250
Interest Rate
5.53%
Mortgage Type
Unknown
Create a Home Valuation Report for This Property
The Home Valuation Report is an in-depth analysis detailing your home's value as well as a comparison with similar homes in the area
Home Values in the Area
Average Home Value in this Area
Purchase History
| Date | Buyer | Sale Price | Title Company |
|---|---|---|---|
| Cornelius Michael C | -- | Advantage Title | |
| Cornelius Michael C | -- | Advantage Title | |
| Cornelius Michael C | -- | None Available | |
| Cornelius Michael C | $622,000 | First American Title Co |
Source: Public Records
Mortgage History
| Date | Status | Borrower | Loan Amount |
|---|---|---|---|
| Open | Cornelius Family Trust | $100,000 | |
| Open | Cornelius Michael C | $753,250 | |
| Closed | Cornellius Michael C | $690,000 | |
| Closed | Cornelius Michael C | $75,000 | |
| Closed | Cornelius Michael C | $580,000 | |
| Closed | Cornelius Michael C | $130,000 | |
| Closed | Cornelius Michael C | $452,000 | |
| Closed | Cornelius Michael C | $80,000 | |
| Closed | Cornelius Michael C | $40,000 | |
| Closed | Cornelius Michael C | $497,250 |
Source: Public Records
Tax History Compared to Growth
Tax History
| Year | Tax Paid | Tax Assessment Tax Assessment Total Assessment is a certain percentage of the fair market value that is determined by local assessors to be the total taxable value of land and additions on the property. | Land | Improvement |
|---|---|---|---|---|
| 2024 | $13,342 | $882,612 | $369,174 | $513,438 |
| 2023 | $13,109 | $865,307 | $361,936 | $503,371 |
| 2022 | $12,918 | $848,341 | $354,840 | $493,501 |
| 2021 | $12,700 | $831,708 | $347,883 | $483,825 |
| 2020 | $12,627 | $823,180 | $344,316 | $478,864 |
| 2019 | $12,382 | $807,040 | $337,565 | $469,475 |
| 2018 | $12,185 | $791,217 | $330,947 | $460,270 |
| 2017 | $12,162 | $775,704 | $324,458 | $451,246 |
| 2016 | $12,133 | $760,496 | $318,097 | $442,399 |
| 2015 | $12,954 | $749,073 | $313,319 | $435,754 |
| 2014 | $12,728 | $734,401 | $307,182 | $427,219 |
Source: Public Records
Map
Nearby Homes
- 7718 Via Vivaldi
- 7684 Sonata Ln
- 14640 Via Bergamo
- 7557 Crescendo Ln
- 7725 Cantata Ln
- 14656 Via Fiesta
- 14658 Via Fiesta Unit 3
- 14523 Caminito Lazanja
- 14675 Plein Aire Ct
- 14662 Encendido
- 7630 Iluminado
- 14420 Rancho Del Prado Trail
- 7559 Northern Lights
- 6868 Spyglass Ln
- 7930 Entrada Lazanja
- 0 Spyglass Ln Unit 42 250018397
- 8305 Santaluz Village Green E
- 8128 Run of the Knolls
- 17381 Circa Oriente
- 14317 Salida Del Sol
- 14686 Via Monteverde
- 14690 Via Monteverde
- 14682 Via Monteverde
- 14678 Via Monteverde
- 14694 Via Monteverde
- 7697 Via Vivaldi
- 7687 Via Vivaldi
- 14674 Via Monteverde
- 7707 Via Vivaldi
- 7677 Via Vivaldi
- 14698 Via Monteverde
- 7717 Via Vivaldi
- 7667 Via Vivaldi
- 7727 Via Vivaldi
- 7657 Via Vivaldi
- 14712 Via Mantova
- 14704 Via Mantova
- 14708 Via Mantova
- 14716 Via Mantova
- 14720 Via Mantova