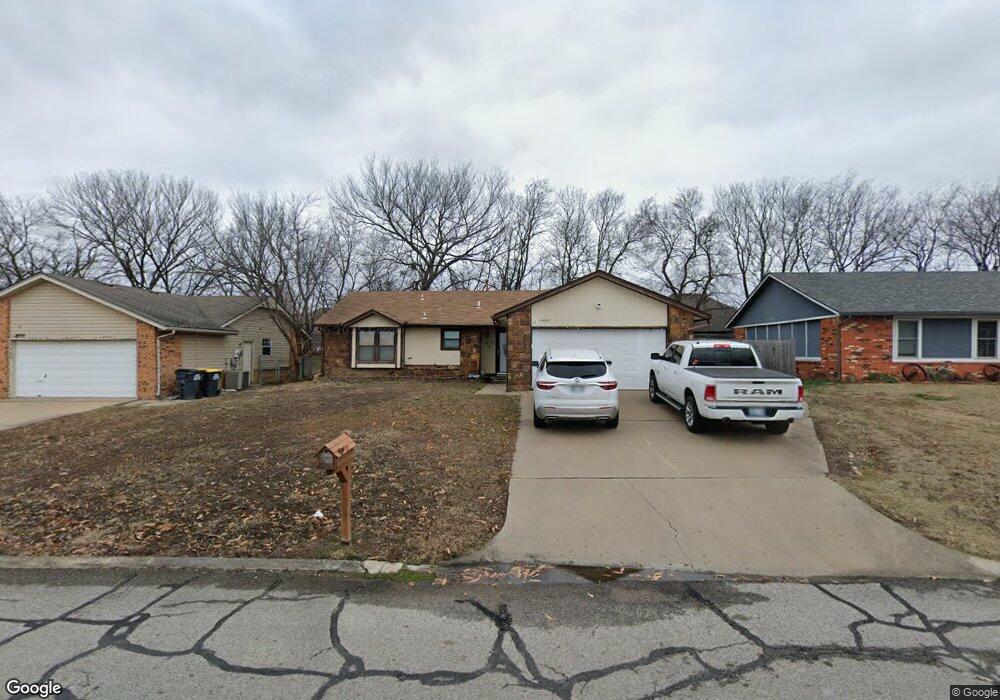
14688 S Yukon Ave Glenpool, OK 74033
Estimated Value: $189,000 - $205,000
4
Beds
2
Baths
1,352
Sq Ft
$146/Sq Ft
Est. Value
About This Home
This home is located at 14688 S Yukon Ave, Glenpool, OK 74033 and is currently estimated at $197,926, approximately $146 per square foot. 14688 S Yukon Ave is a home located in Tulsa County with nearby schools including Glenpool Elementary School, Glenpool Middle School, and Glenpool High School.
Ownership History
Date
Name
Owned For
Owner Type
Purchase Details
Closed on
Jul 23, 2020
Sold by
Radford Troy D
Bought by
Radford Lisamarie E
Current Estimated Value
Home Financials for this Owner
Home Financials are based on the most recent Mortgage that was taken out on this home.
Original Mortgage
$106,400
Outstanding Balance
$93,927
Interest Rate
3.1%
Mortgage Type
New Conventional
Estimated Equity
$103,999
Purchase Details
Closed on
Nov 19, 2009
Sold by
Easton Melissa Danae and Zak Dale
Bought by
Radford Troy D and Radford Lisamarie E
Home Financials for this Owner
Home Financials are based on the most recent Mortgage that was taken out on this home.
Original Mortgage
$104,080
Interest Rate
4.99%
Mortgage Type
FHA
Purchase Details
Closed on
Feb 8, 2002
Sold by
Zak Melissa K and Zak Dale
Bought by
Zak Dale and Zak Melissa D
Purchase Details
Closed on
Feb 10, 1999
Sold by
Easton James Thomas
Bought by
Easton Melissa Danae
Purchase Details
Closed on
Apr 1, 1990
Create a Home Valuation Report for This Property
The Home Valuation Report is an in-depth analysis detailing your home's value as well as a comparison with similar homes in the area
Home Values in the Area
Average Home Value in this Area
Purchase History
| Date | Buyer | Sale Price | Title Company |
|---|---|---|---|
| Radford Lisamarie E | -- | Oklahoma Secured Tile | |
| Radford Troy D | $106,000 | Tulsa Abstract & Title | |
| Zak Dale | -- | Tulsa Abstract & Title Co | |
| Easton Melissa Danae | -- | -- | |
| -- | $54,500 | -- |
Source: Public Records
Mortgage History
| Date | Status | Borrower | Loan Amount |
|---|---|---|---|
| Open | Radford Lisamarie E | $106,400 | |
| Closed | Radford Troy D | $104,080 |
Source: Public Records
Tax History Compared to Growth
Tax History
| Year | Tax Paid | Tax Assessment Tax Assessment Total Assessment is a certain percentage of the fair market value that is determined by local assessors to be the total taxable value of land and additions on the property. | Land | Improvement |
|---|---|---|---|---|
| 2025 | $1,559 | $13,003 | $1,218 | $11,785 |
| 2024 | $1,428 | $12,595 | $1,362 | $11,233 |
| 2023 | $1,428 | $13,198 | $1,531 | $11,667 |
| 2022 | $1,362 | $11,815 | $1,828 | $9,987 |
| 2021 | $1,339 | $11,441 | $1,770 | $9,671 |
| 2020 | $1,467 | $12,441 | $1,925 | $10,516 |
| 2019 | $1,477 | $12,441 | $1,925 | $10,516 |
| 2018 | $1,471 | $12,441 | $1,925 | $10,516 |
| 2017 | $1,439 | $12,441 | $1,925 | $10,516 |
| 2016 | $1,430 | $12,243 | $1,894 | $10,349 |
| 2015 | $1,355 | $11,660 | $1,804 | $9,856 |
| 2014 | $1,361 | $11,660 | $1,804 | $9,856 |
Source: Public Records
Map
Nearby Homes
- 14603 S Xenophon Ave
- 467 W 147th Place S
- 571 W 149th Place
- 803 W 150th St
- 41 E 148th St
- 14336 S Barber St
- 15375 S 26th West Ave
- 13708 S Elwood Ave
- 14772 S Fern Place
- 14760 S Fern Place
- 14812 S Fern Place
- 14785 S Fern Place
- 394 E 147th St S
- 205 Taos Dr
- 110 E 156th Place S
- 14910 S Sequoia St
- 14920 S Sequoia St
- 687 E 142nd Place
- 663 E 148th Place S
- 668 E 148th Place S
- 14702 S Yukon Ave
- 756 W 147th St
- 790 W 147th St
- 14713 Jordan Cir
- 14717 Jordan Cir
- 14716 S Yukon Ave
- 14642 S Yukon Ave
- 623 W 147th St
- 14709 Jordan Cir
- 14721 Jordan Ct
- 624 W 146th Place
- 14713 Jordan Ct
- 626 W 147th St
- 14724 S Yukon Ave
- 613 W 147th St
- 626 W 147th St S
- 611 W 147th St
- 14725 Jordan Ct
- 612 W 146th Place
- 612 W 146th Place S