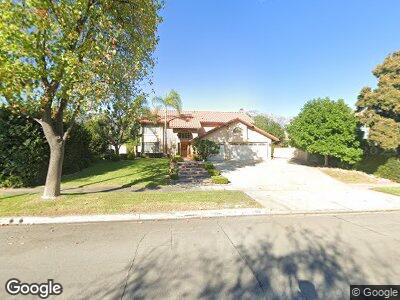
1469 W 18th St Upland, CA 91784
Estimated Value: $970,027 - $1,060,000
4
Beds
3
Baths
2,444
Sq Ft
$413/Sq Ft
Est. Value
About This Home
This home is located at 1469 W 18th St, Upland, CA 91784 and is currently estimated at $1,009,257, approximately $412 per square foot. 1469 W 18th St is a home located in San Bernardino County with nearby schools including Pepper Tree Elementary, Pioneer Junior High School, and Upland High School.
Ownership History
Date
Name
Owned For
Owner Type
Purchase Details
Closed on
Apr 11, 2024
Sold by
Gurrola Edmundo Rene
Bought by
Edmundo Rene Gurrola 2024 Sp Trust and Gurrola
Current Estimated Value
Purchase Details
Closed on
Mar 28, 2024
Sold by
Gurrola Edmundo Rene and Stella Marleen
Bought by
Gurrola Edmundo Rene and Gurrola Stella Marleen
Purchase Details
Closed on
Jun 24, 2003
Sold by
Gurrola Edmundo Rene and Gurrola Stella Marleen
Bought by
Gurrola Edmundo R and Gurrola Stella M
Home Financials for this Owner
Home Financials are based on the most recent Mortgage that was taken out on this home.
Original Mortgage
$245,000
Interest Rate
5.26%
Mortgage Type
Purchase Money Mortgage
Create a Home Valuation Report for This Property
The Home Valuation Report is an in-depth analysis detailing your home's value as well as a comparison with similar homes in the area
Home Values in the Area
Average Home Value in this Area
Purchase History
| Date | Buyer | Sale Price | Title Company |
|---|---|---|---|
| Edmundo Rene Gurrola 2024 Sp Trust | -- | None Listed On Document | |
| Stella Marleen Gurrola 2024 Sp Trust | -- | None Listed On Document | |
| Gurrola Edmundo Rene | -- | None Listed On Document | |
| Gurrola Edmundo R | -- | Fidelity Natl |
Source: Public Records
Mortgage History
| Date | Status | Borrower | Loan Amount |
|---|---|---|---|
| Previous Owner | Gurrola Edmundo R | $75,000 | |
| Previous Owner | Gurrola Edmundo R | $245,000 | |
| Previous Owner | Gurrola Edmundo R | $240,000 | |
| Previous Owner | Gurrola Edmundo R | $24,000 | |
| Previous Owner | Gurrola Edmundo R | $29,625 |
Source: Public Records
Tax History Compared to Growth
Tax History
| Year | Tax Paid | Tax Assessment Tax Assessment Total Assessment is a certain percentage of the fair market value that is determined by local assessors to be the total taxable value of land and additions on the property. | Land | Improvement |
|---|---|---|---|---|
| 2024 | $4,185 | $383,042 | $67,303 | $315,739 |
| 2023 | $4,121 | $375,531 | $65,983 | $309,548 |
| 2022 | $4,030 | $368,167 | $64,689 | $303,478 |
| 2021 | $4,023 | $360,948 | $63,421 | $297,527 |
| 2020 | $3,913 | $357,247 | $62,771 | $294,476 |
| 2019 | $3,899 | $350,242 | $61,540 | $288,702 |
| 2018 | $3,803 | $343,374 | $60,333 | $283,041 |
| 2017 | $3,693 | $336,641 | $59,150 | $277,491 |
| 2016 | $3,488 | $330,040 | $57,990 | $272,050 |
| 2015 | $3,408 | $325,083 | $57,119 | $267,964 |
| 2014 | $3,319 | $318,715 | $56,000 | $262,715 |
Source: Public Records
Map
Nearby Homes
- 1647 Carmel Cir E
- 1705 Almond Tree Place
- 2003 Springcreek Cir
- 1992 Moonbeam Cir
- 1730 W Alps Dr
- 1407 Brookdale Dr
- 2048 Birkdale Ave
- 1572 Wedgewood Way
- 1571 Oakdale Ct
- 1179 W Rae Ct
- 1431 Sunrise Cir S
- 1640 Purple Heart Place
- 1760 Acadia Place
- 1634 Crepe Myrtle Place
- 1482 Bibiana Way
- 1407 Sunrise Cir N
- 1752 Apricot Tree Place
- 1749 Franklin Tree Place
- 2166 Malati Cir
- 1418 Lemonwood Dr W
- 1469 W 18th St
- 1473 W 18th St
- 1457 W 18th St
- 1485 W 18th St
- 1445 W 18th St
- 1815 Wilson Ave
- 1493 W 18th St
- 1823 Wilson Ave
- 1474 W 18th St
- 1496 Sun River St
- 1835 Wilson Ave
- 1795 Wilson Ave
- 1466 W 18th St
- 1484 W 18th St
- 1826 Sugarloaf Ave
- 1490 W 18th St
- 1501 W 18th St
- 1502 Sun River St
- 1787 Wilson Ave
- 1804 Wilson Ave