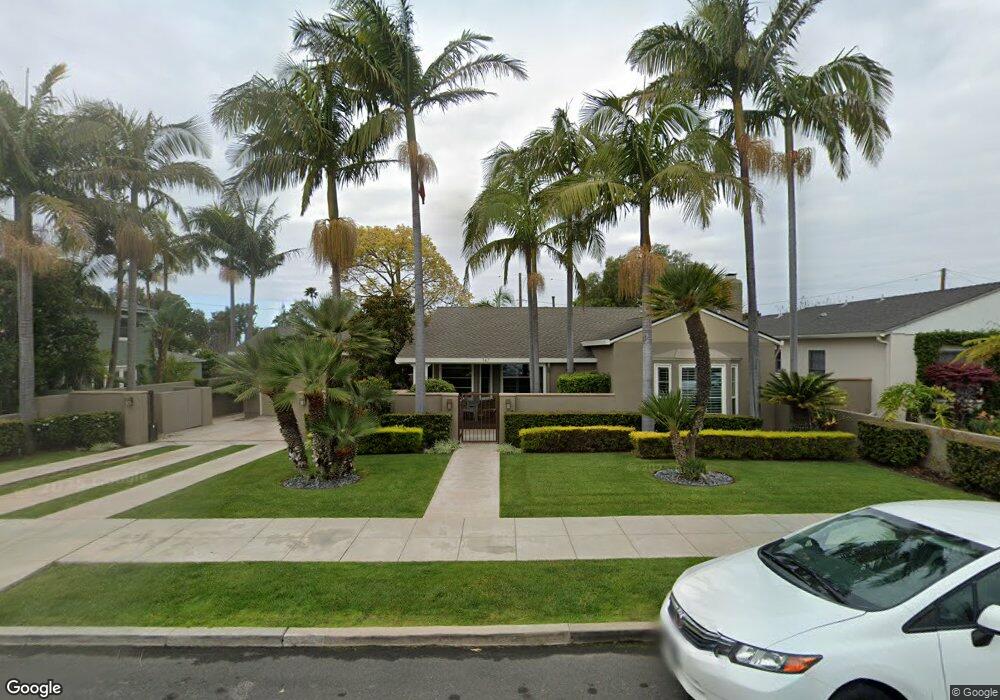
147 N Evergreen Dr Ventura, CA 93003
Midtown NeighborhoodEstimated Value: $947,000 - $1,622,000
3
Beds
2
Baths
1,874
Sq Ft
$735/Sq Ft
Est. Value
About This Home
This home is located at 147 N Evergreen Dr, Ventura, CA 93003 and is currently estimated at $1,377,142, approximately $734 per square foot. 147 N Evergreen Dr is a home located in Ventura County with nearby schools including Loma Vista Elementary School, Cabrillo Middle School, and Ventura High School.
Ownership History
Date
Name
Owned For
Owner Type
Purchase Details
Closed on
Jul 26, 2024
Sold by
David A Hilty Trust and Kapp Riki A
Bought by
Kapp Riki A
Current Estimated Value
Purchase Details
Closed on
Oct 7, 2010
Sold by
Hilty David A
Bought by
Hilty David A
Purchase Details
Closed on
Jan 27, 2003
Sold by
Hilty David A
Bought by
Hilty David A and The David A Hilty Trust
Home Financials for this Owner
Home Financials are based on the most recent Mortgage that was taken out on this home.
Original Mortgage
$151,000
Interest Rate
5%
Purchase Details
Closed on
Apr 17, 2001
Sold by
Hilty David A
Bought by
Hilty David A and Kapp Riki A
Purchase Details
Closed on
Feb 23, 2000
Sold by
Hilty David A and Kapp Riki A
Bought by
Hilty David A
Create a Home Valuation Report for This Property
The Home Valuation Report is an in-depth analysis detailing your home's value as well as a comparison with similar homes in the area
Home Values in the Area
Average Home Value in this Area
Purchase History
| Date | Buyer | Sale Price | Title Company |
|---|---|---|---|
| Kapp Riki A | -- | None Listed On Document | |
| Hilty David A | -- | Chicago Title Company | |
| Hilty David A | -- | Chicago Title Company | |
| Hilty David A | -- | Fidelity National Title Co | |
| Hilty David A | -- | Fidelity National Title Co | |
| Hilty David A | -- | American Title Co | |
| Hilty David A | -- | -- |
Source: Public Records
Mortgage History
| Date | Status | Borrower | Loan Amount |
|---|---|---|---|
| Previous Owner | Hilty David A | $151,000 |
Source: Public Records
Tax History Compared to Growth
Tax History
| Year | Tax Paid | Tax Assessment Tax Assessment Total Assessment is a certain percentage of the fair market value that is determined by local assessors to be the total taxable value of land and additions on the property. | Land | Improvement |
|---|---|---|---|---|
| 2025 | $4,950 | $458,176 | $236,924 | $221,252 |
| 2024 | $4,950 | $449,193 | $232,279 | $216,914 |
| 2023 | $4,890 | $440,386 | $227,725 | $212,661 |
| 2022 | $4,556 | $431,751 | $223,259 | $208,492 |
| 2021 | $4,468 | $423,286 | $218,882 | $204,404 |
| 2020 | $4,425 | $418,948 | $216,639 | $202,309 |
| 2019 | $4,343 | $410,735 | $212,392 | $198,343 |
| 2018 | $4,270 | $402,682 | $208,228 | $194,454 |
| 2017 | $4,180 | $394,788 | $204,146 | $190,642 |
| 2016 | $4,098 | $387,048 | $200,144 | $186,904 |
| 2015 | $4,055 | $381,237 | $197,139 | $184,098 |
| 2014 | $3,988 | $373,771 | $193,278 | $180,493 |
Source: Public Records
Map
Nearby Homes
- 2418 Lexington Dr
- 2542 Poli St
- 69 S Seaward Ave
- Plan D at Portalvo - Townhomes
- Plan F at Portalvo - Townhomes
- Plan E at Portalvo - Townhomes
- Plan O at Portalvo - Condos/Flats
- Plan A at Portalvo - Townhomes
- Plan H at Portalvo - Condos/Flats
- Plan L at Portalvo - Condos/Flats
- Plan C at Portalvo - Townhomes
- Plan B at Portalvo - Townhomes
- Plan J at Portalvo - Condos/Flats
- Plan G at Portalvo - Townhomes
- Plan N at Portalvo - Condos/Flats
- Plan K at Portalvo - Condos/Flats
- Plan M at Portalvo - Condos/Flats
- 66 San Clemente St
- 205 Jordan Ave
- 505 Briarwood Terrace
- 159 N Evergreen Dr
- 135 N Evergreen Dr
- 2427 Mckinley Dr
- 167 N Evergreen Dr
- 130 N Seaward Ave
- 2417 Mckinley Dr
- 175 N Evergreen Dr
- 152 N Evergreen Dr
- 142 N Evergreen Dr
- 2407 Mckinley Dr
- 160 N Evergreen Dr
- 2489 Mckinley Dr
- 2446 Mckinley Dr
- 168 N Evergreen Dr
- 187 N Evergreen Dr
- 2451 Lexington Dr
- 176 N Evergreen Dr
- 2420 Mckinley Dr
- 2385 Mckinley Dr
- 2488 Mckinley Dr