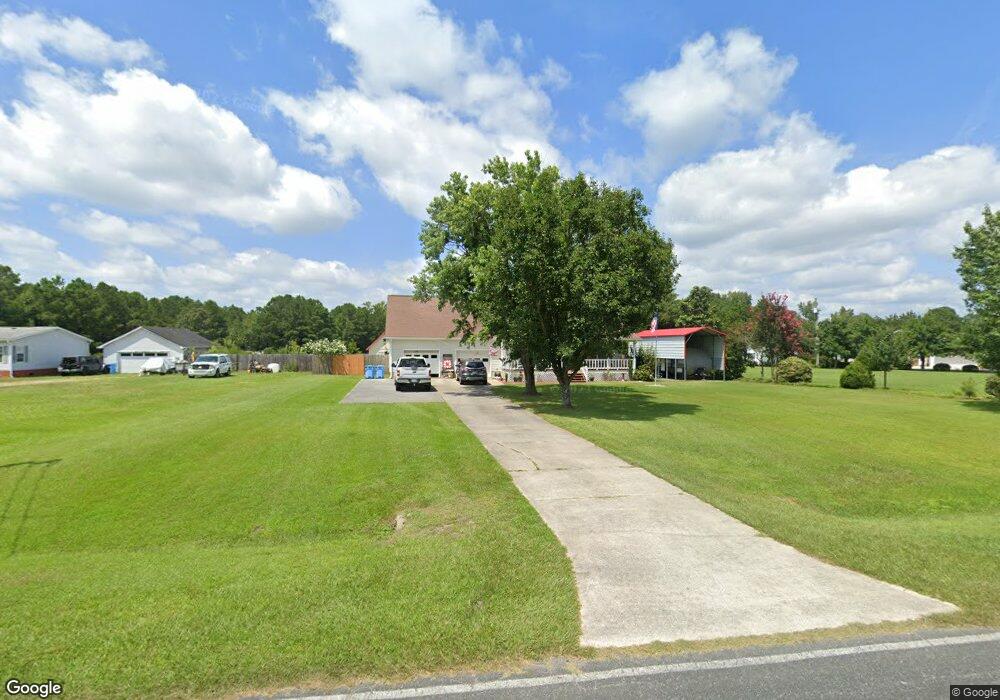
147 Thomas Loop Rd Jacksonville, NC 28540
Estimated Value: $267,000 - $312,000
3
Beds
2
Baths
1,568
Sq Ft
$182/Sq Ft
Est. Value
About This Home
This home is located at 147 Thomas Loop Rd, Jacksonville, NC 28540 and is currently estimated at $285,449, approximately $182 per square foot. 147 Thomas Loop Rd is a home located in Onslow County with nearby schools including Richlands Elementary School, Trexler Middle School, and Richlands High School.
Ownership History
Date
Name
Owned For
Owner Type
Purchase Details
Closed on
Sep 5, 2018
Sold by
Caamano Christine M and Thomas Christine M
Bought by
Caamano Richard and Caamano Beverly Ann
Current Estimated Value
Home Financials for this Owner
Home Financials are based on the most recent Mortgage that was taken out on this home.
Original Mortgage
$163,000
Outstanding Balance
$142,159
Interest Rate
4.6%
Mortgage Type
VA
Estimated Equity
$143,290
Purchase Details
Closed on
May 30, 2018
Sold by
Thomas Gregory Allen
Bought by
Thomas Christine M and Caamano Christine M
Purchase Details
Closed on
Jun 26, 2010
Sold by
Alvidres Aldo A and Alvidres Maria C
Bought by
Thomas Christine M and Caamano Richard
Home Financials for this Owner
Home Financials are based on the most recent Mortgage that was taken out on this home.
Original Mortgage
$165,767
Interest Rate
4.77%
Mortgage Type
FHA
Create a Home Valuation Report for This Property
The Home Valuation Report is an in-depth analysis detailing your home's value as well as a comparison with similar homes in the area
Home Values in the Area
Average Home Value in this Area
Purchase History
| Date | Buyer | Sale Price | Title Company |
|---|---|---|---|
| Caamano Richard | -- | None Available | |
| Thomas Christine M | -- | None Available | |
| Thomas Christine M | $168,000 | None Available |
Source: Public Records
Mortgage History
| Date | Status | Borrower | Loan Amount |
|---|---|---|---|
| Open | Caamano Richard | $163,000 | |
| Closed | Thomas Christine M | $165,767 |
Source: Public Records
Tax History Compared to Growth
Tax History
| Year | Tax Paid | Tax Assessment Tax Assessment Total Assessment is a certain percentage of the fair market value that is determined by local assessors to be the total taxable value of land and additions on the property. | Land | Improvement |
|---|---|---|---|---|
| 2025 | $1,148 | $175,198 | $24,090 | $151,108 |
| 2024 | $1,148 | $175,198 | $24,090 | $151,108 |
| 2023 | $1,148 | $175,198 | $24,090 | $151,108 |
| 2022 | $9 | $175,198 | $24,090 | $151,108 |
| 2021 | $9 | $128,540 | $17,670 | $110,870 |
| 2020 | $9 | $128,540 | $17,670 | $110,870 |
| 2019 | $9 | $122,350 | $17,670 | $104,680 |
| 2018 | $9 | $129,000 | $17,670 | $111,330 |
| 2017 | $103 | $143,230 | $17,670 | $125,560 |
| 2016 | $967 | $143,230 | $0 | $0 |
| 2015 | $967 | $143,230 | $0 | $0 |
| 2014 | $967 | $143,230 | $0 | $0 |
Source: Public Records
Map
Nearby Homes
- 000 Richlands
- 115 Union Chapel Church Rd
- 1.7ac Mcgowan Rd
- 145 Mcgowan
- 306 S Brandon Way
- 119 Casey Ct
- 201 Cypress Branch Way
- 125 Magnolia Gardens Dr
- 124 Billy Hudson Rd
- 115 Billy Hudson Rd
- 203 Grafton Ct
- 302 Brigham Ct
- 205 Lazy River
- 202 Lazy River Ct
- 203 Lazy River Ct
- 206 Lazy River
- 208 Lazy River
- 118 Lindsey James Ln
- 200 Bright Leaf Ln
- 102 Farmington Dr
- 133 Thomas Loop Rd
- 161 Thomas Loop Rd
- 127 Thomas Loop Rd
- 130 Thomas Loop Rd
- 171 Thomas Loop Rd
- 166 Thomas Loop Rd
- 175 Thomas Loop Rd
- 187 Thomas Loop Rd
- 172 Thomas Loop Rd
- 119 Thomas Loop Rd
- 174 Thomas Loop Rd
- 193 Thomas Loop Rd
- 188 Thomas Loop Rd
- 197 Thomas Loop Rd
- 198 Thomas Loop Rd
- 5960 Richlands Hwy
- 205 Thomas Loop Rd
- 112 NW Bridge Rd
- 192 Thomas Loop Rd
- 219 Thomas Loop Rd