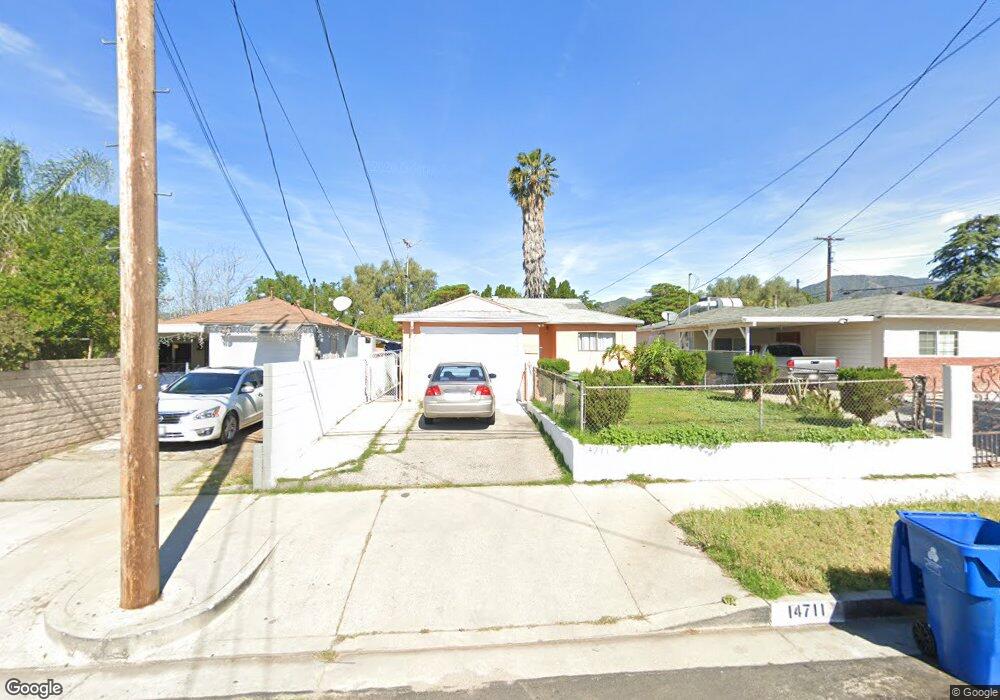
14711 Astoria St Sylmar, CA 91342
Estimated Value: $638,386 - $852,000
2
Beds
1
Bath
854
Sq Ft
$871/Sq Ft
Est. Value
About This Home
This home is located at 14711 Astoria St, Sylmar, CA 91342 and is currently estimated at $744,097, approximately $871 per square foot. 14711 Astoria St is a home located in Los Angeles County with nearby schools including Dyer Street Elementary School, Olive Vista Middle School, and San Fernando Senior High School.
Ownership History
Date
Name
Owned For
Owner Type
Purchase Details
Closed on
May 10, 2024
Sold by
Cortes Maria De Los Angeles
Bought by
Familia Bendecida Revocable Living Trust and Cortes
Current Estimated Value
Purchase Details
Closed on
Aug 28, 2017
Sold by
Cortes Maria De Los Angeles
Bought by
Cortes Maria De Los Angeles
Purchase Details
Closed on
Jun 5, 2000
Sold by
Moya Gloria
Bought by
Cortez Maria
Purchase Details
Closed on
Dec 19, 1996
Sold by
Moya Antonio
Bought by
Moya Gloria and Cortez Maria
Purchase Details
Closed on
Jul 13, 1995
Sold by
Chacon Alma
Bought by
Moya Antonio and Moya Gloria
Purchase Details
Closed on
Oct 26, 1994
Sold by
Mendoza Armando
Bought by
Moya Antonio and Moya Gloria Cortes
Home Financials for this Owner
Home Financials are based on the most recent Mortgage that was taken out on this home.
Original Mortgage
$132,362
Interest Rate
9.28%
Mortgage Type
FHA
Create a Home Valuation Report for This Property
The Home Valuation Report is an in-depth analysis detailing your home's value as well as a comparison with similar homes in the area
Home Values in the Area
Average Home Value in this Area
Purchase History
| Date | Buyer | Sale Price | Title Company |
|---|---|---|---|
| Familia Bendecida Revocable Living Trust | -- | None Listed On Document | |
| Cortes Maria De Los Angeles | -- | None Available | |
| Cortez Maria | -- | -- | |
| Moya Gloria | -- | -- | |
| Moya Antonio | -- | -- | |
| Moya Antonio | $127,000 | Chicago Title Company |
Source: Public Records
Mortgage History
| Date | Status | Borrower | Loan Amount |
|---|---|---|---|
| Previous Owner | Moya Antonio | $132,362 |
Source: Public Records
Tax History Compared to Growth
Tax History
| Year | Tax Paid | Tax Assessment Tax Assessment Total Assessment is a certain percentage of the fair market value that is determined by local assessors to be the total taxable value of land and additions on the property. | Land | Improvement |
|---|---|---|---|---|
| 2025 | $2,474 | $719,100 | $503,880 | $215,220 |
| 2024 | $2,474 | $195,885 | $88,509 | $107,376 |
| 2023 | $2,427 | $192,045 | $86,774 | $105,271 |
| 2022 | $2,315 | $188,280 | $85,073 | $103,207 |
| 2021 | $2,283 | $184,589 | $83,405 | $101,184 |
| 2020 | $2,302 | $182,697 | $82,550 | $100,147 |
| 2019 | $2,215 | $179,116 | $80,932 | $98,184 |
| 2018 | $2,146 | $175,605 | $79,346 | $96,259 |
| 2016 | $2,041 | $168,788 | $76,266 | $92,522 |
| 2015 | $2,011 | $166,254 | $75,121 | $91,133 |
| 2014 | $2,025 | $162,998 | $73,650 | $89,348 |
Source: Public Records
Map
Nearby Homes
- 14761 Astoria St
- 12528 Bradley Ave
- 12642 Ralston Ave Unit 1
- 12659 Ralston Ave
- 12796 Norris Ave
- 12867 Norris Ave
- 14594 Lyle St
- 14914 Oswald St
- 12301 San Fernando Rd Unit 514
- 12259 N Lima Way
- 14529 Paddock St
- 14335 Aztec St
- 15057 Paddock St
- 13023 Woodcock Ave
- 13009 Herrick Ave
- 14306 Aztec St
- 15086 Oro Grande St
- 15235 152351/2 Nurmi St
- 13108 Fellows Ave
- 613 N Meyer St
- 14707 Astoria St
- 14715 Astoria St
- 14721 Astoria St
- 14701 Astoria St
- 12647 Bradley Ave
- 14723 Astoria St
- 14727 Astoria St
- 12653 Bradley Ave
- 14712 Astoria St
- 14708 Astoria St
- 12640 Bradley Ave
- 12630 Bradley Ave
- 14716 Astoria St
- 14702 Astoria St
- 14735 Astoria St
- 12659 Bradley Ave
- 14726 Astoria St
- 14651 Astoria St
- 14656 Astoria St
- 14728 Astoria St