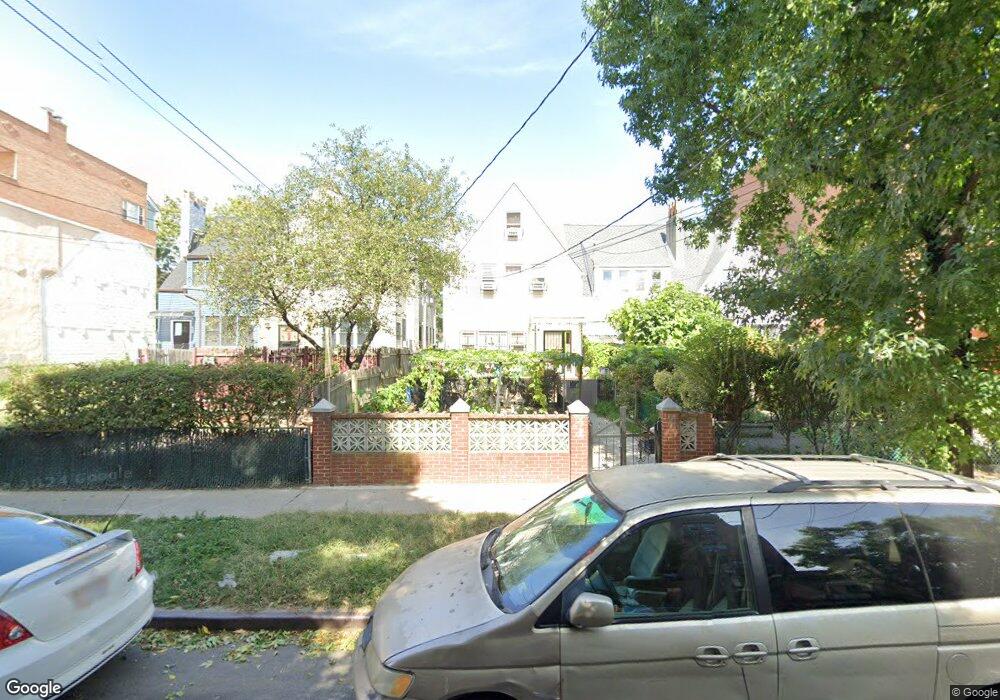
14717 41st Ave Flushing, NY 11355
Murray Hill-Broadway NeighborhoodEstimated Value: $1,330,000 - $1,636,000
Studio
--
Bath
2,080
Sq Ft
$736/Sq Ft
Est. Value
About This Home
This home is located at 14717 41st Ave, Flushing, NY 11355 and is currently estimated at $1,530,333, approximately $735 per square foot. 14717 41st Ave is a home located in Queens County with nearby schools including P.S. 22 - Thomas Jefferson, J.H.S. 189Q Daniel Carter Beard, and Flushing High School.
Ownership History
Date
Name
Owned For
Owner Type
Purchase Details
Closed on
Nov 12, 2014
Sold by
Cha An Shin Cha and Cha Kim Shin
Bought by
Chen Yan and Chen Zhong Qun
Current Estimated Value
Home Financials for this Owner
Home Financials are based on the most recent Mortgage that was taken out on this home.
Original Mortgage
$508,800
Outstanding Balance
$390,046
Interest Rate
4.02%
Mortgage Type
Commercial
Estimated Equity
$1,140,287
Purchase Details
Closed on
Apr 26, 2001
Sold by
Lee Hak Soon and Lee Young Ja
Bought by
An Shin Cha
Home Financials for this Owner
Home Financials are based on the most recent Mortgage that was taken out on this home.
Original Mortgage
$180,000
Interest Rate
7.15%
Mortgage Type
Purchase Money Mortgage
Purchase Details
Closed on
Jul 15, 1998
Sold by
Kim Yo Duck and Kim Tom
Bought by
Lee Hak Soon and Lee Young Ja
Home Financials for this Owner
Home Financials are based on the most recent Mortgage that was taken out on this home.
Original Mortgage
$194,000
Interest Rate
6.9%
Mortgage Type
Purchase Money Mortgage
Create a Home Valuation Report for This Property
The Home Valuation Report is an in-depth analysis detailing your home's value as well as a comparison with similar homes in the area
Home Values in the Area
Average Home Value in this Area
Purchase History
| Date | Buyer | Sale Price | Title Company |
|---|---|---|---|
| Chen Yan | $848,000 | -- | |
| An Shin Cha | -- | -- | |
| Lee Hak Soon | $216,000 | First American Title Ins Co |
Source: Public Records
Mortgage History
| Date | Status | Borrower | Loan Amount |
|---|---|---|---|
| Open | Chen Yan | $508,800 | |
| Previous Owner | An Shin Cha | $180,000 | |
| Previous Owner | Lee Hak Soon | $194,000 |
Source: Public Records
Tax History
| Year | Tax Paid | Tax Assessment Tax Assessment Total Assessment is a certain percentage of the fair market value that is determined by local assessors to be the total taxable value of land and additions on the property. | Land | Improvement |
|---|---|---|---|---|
| 2025 | $8,715 | $47,476 | $13,043 | $34,433 |
| 2024 | $8,727 | $44,789 | $12,797 | $31,992 |
| 2023 | $8,406 | $43,254 | $12,111 | $31,143 |
| 2022 | $7,991 | $75,660 | $20,160 | $55,500 |
| 2021 | $8,292 | $80,940 | $20,160 | $60,780 |
| 2020 | $8,078 | $69,600 | $20,160 | $49,440 |
| 2019 | $7,515 | $76,680 | $20,160 | $56,520 |
| 2018 | $7,540 | $36,045 | $10,862 | $25,183 |
Source: Public Records
Map
Nearby Homes
- 147-26 Roosevelt Ave Unit L1
- 144-85 Roosevelt Ave Unit 5E
- 144-85 Roosevelt Ave Unit 2D
- 144-70 41st Ave Unit 4D
- 144-70 41st Ave Unit 1H & 2H
- 147-37 Roosevelt Ave Unit 5D
- 147-37 Roosevelt Ave Unit 2C
- 144-69 Barclay Ave Unit 4A
- 144-69 Barclay Ave Unit 7C
- 147-45 Barclay Ave Unit 5B
- 144-56 Roosevelt Ave Unit 5B
- 144-77 Roosevelt Ave Unit 8
- 14477 Roosevelt Ave Unit 5C
- 144-44 41st Ave Unit 5
- 144-44 41st Ave Unit 2N
- 144-44 41st Ave Unit 1F
- 144-49 Barclay Ave Unit C1
- 38-08 147th St Unit 4B
- 38-08 147th St Unit 6E
- 147- 25 38th Ave Unit F26
- 147-17 41st Ave
- 14719 41st Ave
- 147-15 41st Ave Unit 2Fl
- 147-15 41st Ave Unit 2nd
- 14715 41st Ave
- 14715 41st Ave Unit 2Fl
- 14721 41st Ave
- 147-11 41st Ave
- 14711 41st Ave
- 14723 41st Ave
- 147-23 41st Ave
- 14729 41st Ave
- 14709 41st Ave
- 14725 41st Ave
- 147-25 41st Ave
- 14707 41st Ave
- 147-27 41st Ave
- 14727 41st Ave
- 14705 41st Ave
- 14703 41st Ave
Your Personal Tour Guide
Ask me questions while you tour the home.