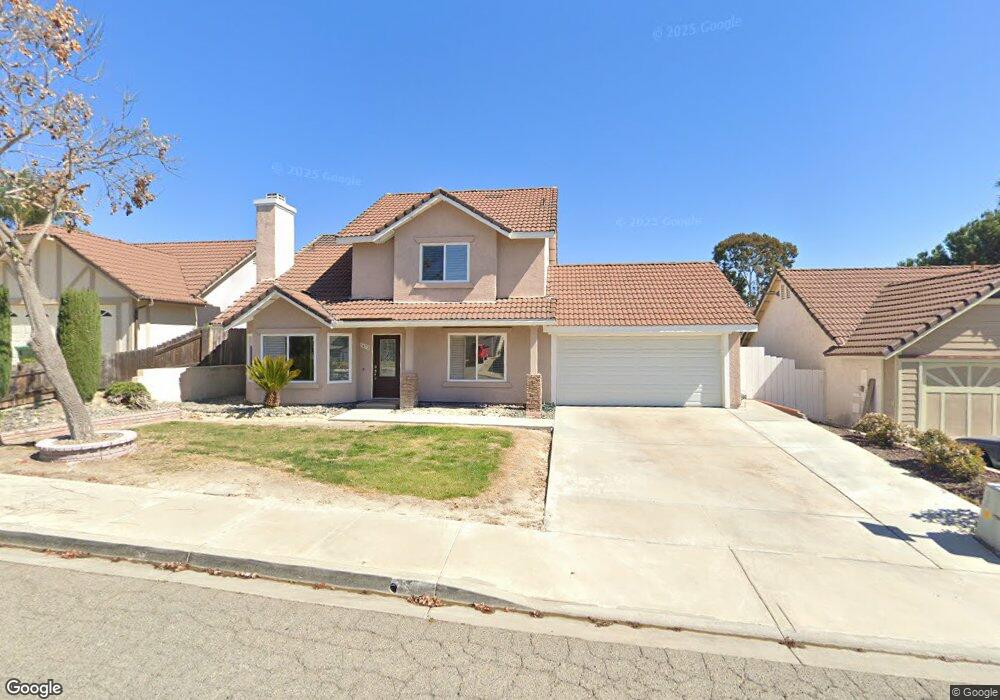
1472 Eastmore Place Oceanside, CA 92056
Peacock NeighborhoodEstimated Value: $797,354 - $879,000
3
Beds
3
Baths
1,450
Sq Ft
$584/Sq Ft
Est. Value
About This Home
This home is located at 1472 Eastmore Place, Oceanside, CA 92056 and is currently estimated at $847,089, approximately $584 per square foot. 1472 Eastmore Place is a home located in San Diego County with nearby schools including T.H.E Leadership Academy, Roosevelt Middle School, and Vista High School.
Ownership History
Date
Name
Owned For
Owner Type
Purchase Details
Closed on
Jul 18, 2000
Sold by
Natalie Family Trust 02-20-93
Bought by
Rodriguez Jaime and Rodriguez Renee
Current Estimated Value
Home Financials for this Owner
Home Financials are based on the most recent Mortgage that was taken out on this home.
Original Mortgage
$218,121
Outstanding Balance
$77,885
Interest Rate
8.2%
Mortgage Type
FHA
Estimated Equity
$769,204
Purchase Details
Closed on
Nov 7, 1998
Sold by
Natalie Michael A and Natalie Cynthia L
Bought by
Natalie Michael A and Natalie Cynthia L
Purchase Details
Closed on
Jun 10, 1993
Sold by
Natalie Michael A and Natalie Cynthia L
Bought by
Natalie Michael A and Natalie Cynthia L
Purchase Details
Closed on
Nov 25, 1987
Create a Home Valuation Report for This Property
The Home Valuation Report is an in-depth analysis detailing your home's value as well as a comparison with similar homes in the area
Home Values in the Area
Average Home Value in this Area
Purchase History
| Date | Buyer | Sale Price | Title Company |
|---|---|---|---|
| Rodriguez Jaime | $221,000 | Chicago Title Co | |
| Natalie Michael A | -- | -- | |
| Natalie Michael A | -- | -- | |
| Natalie Michael A | -- | First American Title Ins Co | |
| -- | $125,000 | -- |
Source: Public Records
Mortgage History
| Date | Status | Borrower | Loan Amount |
|---|---|---|---|
| Open | Rodriguez Jaime | $218,121 |
Source: Public Records
Tax History Compared to Growth
Tax History
| Year | Tax Paid | Tax Assessment Tax Assessment Total Assessment is a certain percentage of the fair market value that is determined by local assessors to be the total taxable value of land and additions on the property. | Land | Improvement |
|---|---|---|---|---|
| 2025 | $3,597 | $332,986 | $107,406 | $225,580 |
| 2024 | $3,597 | $326,457 | $105,300 | $221,157 |
| 2023 | $3,511 | $320,057 | $103,236 | $216,821 |
| 2022 | $3,502 | $313,782 | $101,212 | $212,570 |
| 2021 | $3,424 | $307,630 | $99,228 | $208,402 |
| 2020 | $3,413 | $304,477 | $98,211 | $206,266 |
| 2019 | $3,363 | $298,508 | $96,286 | $202,222 |
| 2018 | $3,197 | $292,656 | $94,399 | $198,257 |
| 2017 | $3,138 | $286,919 | $92,549 | $194,370 |
| 2016 | $3,064 | $281,294 | $90,735 | $190,559 |
| 2015 | $3,052 | $277,070 | $89,373 | $187,697 |
| 2014 | $2,977 | $271,644 | $87,623 | $184,021 |
Source: Public Records
Map
Nearby Homes
- 4867 Meadowbrook Dr
- 1426 Westwood Place
- 1376 Darwin Dr
- 1428 Eastview Ct
- 4835 Glenhaven Dr
- 1609 Fig Tree Way
- 1523 Temple Heights Dr
- 1540 Highridge Dr
- 4813 Rising Glen Dr Unit 1
- 542 Adobe Estates Dr
- 515 Mynah Place
- 615 North Ave
- 5010 Palmera Dr
- 1328 Woodhaven Dr
- 1064 Darwin Dr
- 1702 Havenwood Dr Unit 1087D4
- 1019 Highland Dr
- 1045 Stratton Dr
- 1547 Saran Ct
- 4964 Calle Sobrado
- 1468 Eastmore Place
- 1476 Eastmore Place
- 4882 Meadowbrook Dr
- 1464 Eastmore Place
- 1446 Crestview Dr
- 4876 Meadowbrook Dr
- 1442 Crestview Dr
- 4886 Meadowbrook Dr
- 1473 Eastmore Place
- 1460 Eastmore Place
- 1438 Crestview Dr
- 1469 Eastmore Place
- 4874 Meadowbrook Dr
- 1465 Eastmore Place
- 4879 Meadowbrook Dr
- 4881 Meadowbrook Dr
- 1434 Crestview Dr
- 1456 Eastmore Place
- 4883 Meadowbrook Dr
- 4877 Meadowbrook Dr