14720 Flanner St La Puente, CA 91744
West Puente Valley NeighborhoodEstimated Value: $737,521 - $818,000
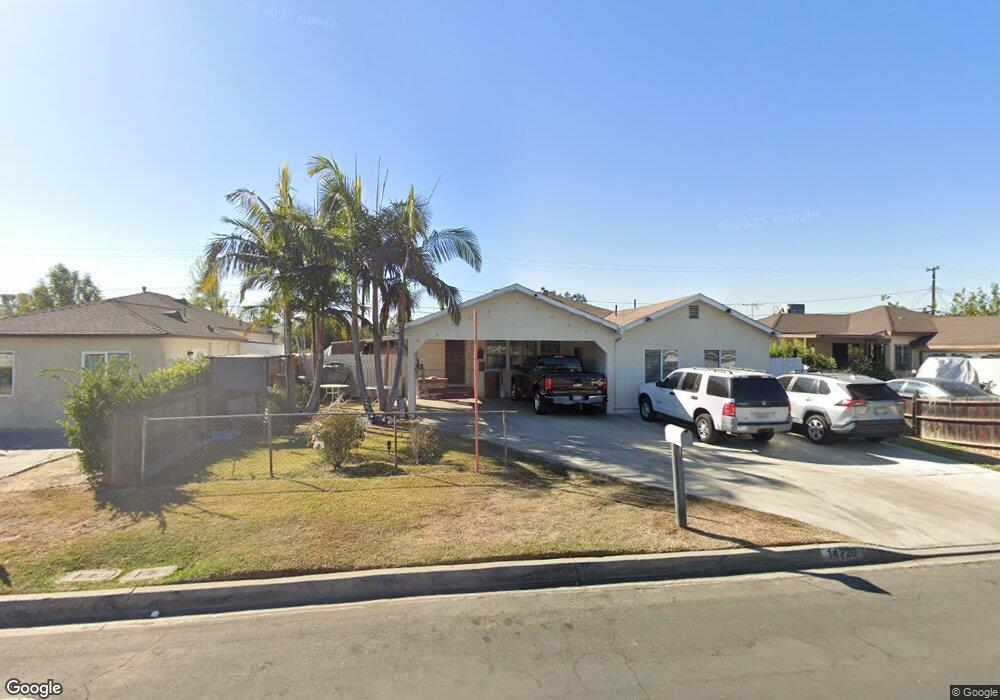
About This Home
This home is located at 14720 Flanner St, La Puente, CA 91744 and is currently estimated at $766,630, approximately $597 per square foot. 14720 Flanner St is a home located in Los Angeles County with nearby schools including Sparks Middle School, La Puente High School, and Hillside Baptist Academy.
Ownership History
We collect this data history from publicly available records. To have your information removed, we recommend requesting removal directly through your county’s website.
Purchase Details
Home Financials for this Owner
Home Financials are based on the most recent Mortgage that was taken out on this home.Purchase Details
Home Financials for this Owner
Home Financials are based on the most recent Mortgage that was taken out on this home.Purchase Details
Home Values in the Area
Average Home Value in this Area
Purchase History
We collect this data history from publicly available records. To have your information removed, we recommend requesting removal directly through your county’s website.
| Date | Buyer | Sale Price | Title Company |
|---|---|---|---|
| -- | -- | ||
| $113,000 | First American Title Co | ||
| $92,000 | Stewart Title |
Mortgage History
We collect this data history from publicly available records. To have your information removed, we recommend requesting removal directly through your county’s website.
| Date | Status | Borrower | Loan Amount |
|---|---|---|---|
| Open | $112,198 |
Tax History
We collect this data history from publicly available records. To have your information removed, we recommend requesting removal directly through your county’s website.
| Year | Tax Paid | Tax Assessment Tax Assessment Total Assessment is a certain percentage of the fair market value that is determined by local assessors to be the total taxable value of land and additions on the property. | Land | Improvement |
|---|---|---|---|---|
| 2025 | $3,274 | $229,928 | $108,245 | $121,683 |
| 2024 | $3,085 | $225,421 | $106,123 | $119,298 |
| 2023 | $3,007 | $221,002 | $104,043 | $116,959 |
| 2022 | $2,922 | $216,669 | $102,003 | $114,666 |
| 2021 | $2,865 | $212,421 | $100,003 | $112,418 |
| 2019 | $2,785 | $206,123 | $97,038 | $109,085 |
| 2018 | $2,666 | $202,083 | $95,136 | $106,947 |
| 2017 | $56 | $198,121 | $93,271 | $104,850 |
| 2016 | $2,470 | $194,238 | $91,443 | $102,795 |
| 2015 | $2,424 | $191,321 | $90,070 | $101,251 |
| 2014 | $2,389 | $187,574 | $88,306 | $99,268 |
Map
- 1033 Clintwood Ave
- 14844 Hartsville St
- 776 Dade Ave
- 509 Sandy Hook Ave
- 731 N Orange Ave
- 527 Melham Ave
- 15145 Beckner St
- 431 Cabana Ave
- 15204 Giordano St
- 14333 Beckner St
- 1123 Aldgate Ave
- 544 N Orange Ave Unit B
- 1133 Aldgate Ave
- 1139 Aldgate Ave
- 14309 Beckner St
- 338 Conlon Ave
- 1420 Glenshaw Dr
- 1528 W Delvale St
- 1215 W Windsor St
- 15316 Giordano St
- 14726 Flanner St Unit B
- 14726 Flanner St
- 14714 Flanner St
- 14721 Flynn St
- 14715 Flynn St
- 14727 Flynn St
- 14732 Flanner St
- 14708 Flanner St
- 829 Broadmoor Ave
- 14709 Flynn St
- 14733 Flynn St
- 828 Broadmoor Ave
- 14738 Flanner St
- 14702 Flanner St
- 835 Broadmoor Ave
- 14703 Flynn St
- 14739 Flynn St
- 828 Radway Ave
- 834 Broadmoor Ave
- 14744 Flanner St
Ask me questions while you tour the home.