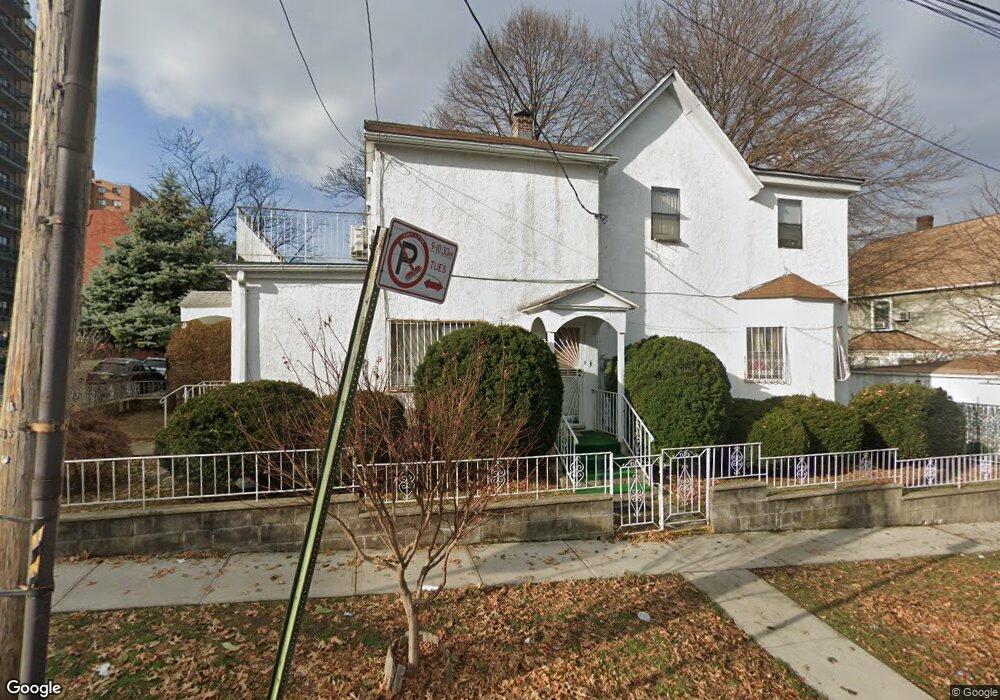
14729 35th Ave Unit 2 Fl Flushing, NY 11354
Murray Hill-Broadway NeighborhoodEstimated Value: $1,310,000 - $1,750,000
4
Beds
1
Bath
1,000
Sq Ft
$1,457/Sq Ft
Est. Value
About This Home
This home is located at 14729 35th Ave Unit 2 Fl, Flushing, NY 11354 and is currently estimated at $1,457,058, approximately $1,457 per square foot. 14729 35th Ave Unit 2 Fl is a home located in Queens County with nearby schools including P.S. 21 Edward Hart, Jhs 185 Edward Bleeker, and Flushing High School.
Ownership History
Date
Name
Owned For
Owner Type
Purchase Details
Closed on
Nov 18, 2016
Sold by
Shanpchiang Chien and Chiang Sonya
Bought by
Chiang Chien S
Current Estimated Value
Create a Home Valuation Report for This Property
The Home Valuation Report is an in-depth analysis detailing your home's value as well as a comparison with similar homes in the area
Home Values in the Area
Average Home Value in this Area
Purchase History
| Date | Buyer | Sale Price | Title Company |
|---|---|---|---|
| Chiang Chien S | -- | -- |
Source: Public Records
Tax History
| Year | Tax Paid | Tax Assessment Tax Assessment Total Assessment is a certain percentage of the fair market value that is determined by local assessors to be the total taxable value of land and additions on the property. | Land | Improvement |
|---|---|---|---|---|
| 2025 | $4,555 | $49,015 | $11,714 | $37,301 |
| 2024 | $4,567 | $48,154 | $11,564 | $36,590 |
| 2023 | $4,295 | $45,572 | $12,114 | $33,458 |
| 2022 | $4,434 | $74,400 | $21,180 | $53,220 |
| 2021 | $4,432 | $69,960 | $21,180 | $48,780 |
| 2020 | $4,459 | $73,800 | $21,180 | $52,620 |
| 2019 | $4,324 | $81,300 | $21,180 | $60,120 |
| 2018 | $7,444 | $37,977 | $14,052 | $23,925 |
| 2017 | $7,004 | $35,830 | $13,258 | $22,572 |
| 2016 | $6,495 | $35,830 | $13,258 | $22,572 |
| 2015 | $3,857 | $34,038 | $15,421 | $18,617 |
| 2014 | $3,857 | $33,440 | $14,418 | $19,022 |
Source: Public Records
Map
Nearby Homes
- 14705 35th Ave
- 148-04 35th Ave
- 3520 147th St Unit 11E
- 3520 147th St Unit 6A
- 148-09 Northern Blvd Unit 2 J
- 148-09 Northern Blvd Unit 2B
- 148-09 Northern Blvd Unit 4 L
- 148-09 Northern Blvd Unit 6
- 148-09 Northern Blvd Unit 1 D
- 148-09 Northern Blvd Unit 1 G
- 148-09 Northern Blvd Unit 1J
- 146-10 35th Ave Unit 6B
- 14538 34th Ave Unit 6G
- 3508 146th St Unit 2B
- 3301 146th St
- 35-08 146th St Unit 4C
- 35-20 146th St Unit 3B
- 35-20 146th St Unit 5
- 149-06 Northern Blvd Unit 501
- 149-06 Northern Blvd Unit 304
- 14729 35th Ave
- 14729 35th Ave
- 14723 35th Ave
- 147-23 35th Ave
- 3422 148th St
- 34-20 148th St Unit 1R FL
- 34-20 148th St Unit 1 FL
- 34-20 148th St
- 3420 148th St
- 3429 148th St
- 3427 148th St
- 14715 35th Ave
- 147-34 35th Ave
- 14715 35th Ave
- 148-06 35ave Unit 3A
- 148-06 35ave Unit 2A
- 148-06 35ave
- 148-08 35th Ave Unit Ffr
- 148-08 35th Ave
- 148-08 35th Ave Unit 3C
Your Personal Tour Guide
Ask me questions while you tour the home.