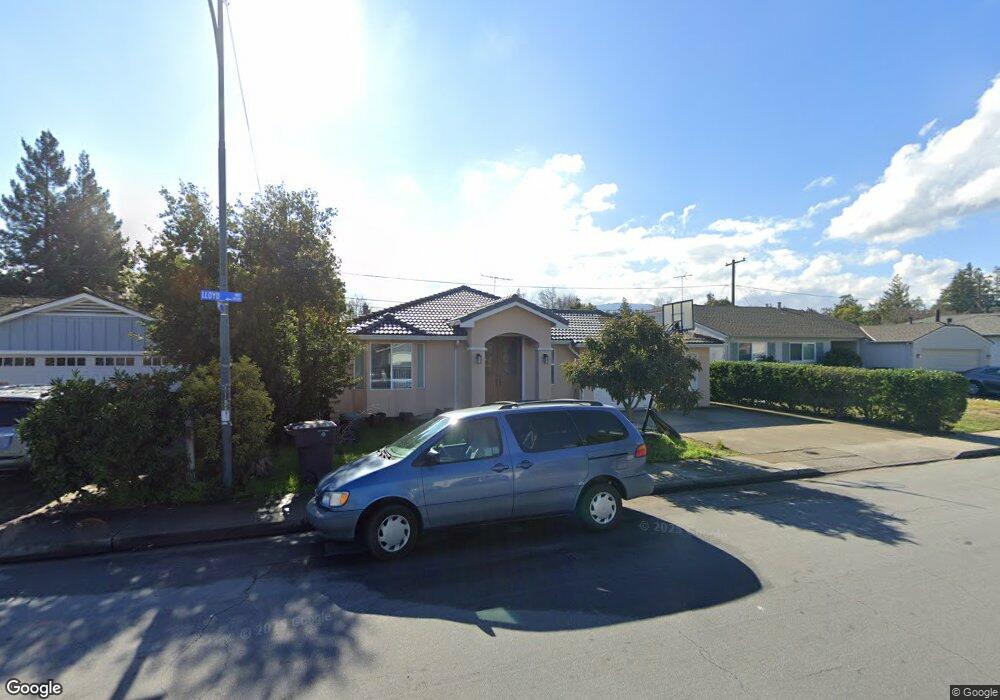
1479 Lloyd Way Mountain View, CA 94040
Mountain View West NeighborhoodEstimated Value: $2,881,000 - $3,514,000
4
Beds
3
Baths
1,505
Sq Ft
$2,153/Sq Ft
Est. Value
About This Home
This home is located at 1479 Lloyd Way, Mountain View, CA 94040 and is currently estimated at $3,240,564, approximately $2,153 per square foot. 1479 Lloyd Way is a home located in Santa Clara County with nearby schools including Springer Elementary School, Georgina P. Blach Junior High School, and Los Altos High School.
Ownership History
Date
Name
Owned For
Owner Type
Purchase Details
Closed on
May 20, 2013
Sold by
Weng Fuliang and Liu Jane
Bought by
Weng Fuliang and Liu Jane
Current Estimated Value
Home Financials for this Owner
Home Financials are based on the most recent Mortgage that was taken out on this home.
Original Mortgage
$220,000
Interest Rate
3.38%
Mortgage Type
New Conventional
Purchase Details
Closed on
Jun 12, 2012
Sold by
Weng Fuliang and Liu Jane
Bought by
Weng Fuliang and Liu Jane
Home Financials for this Owner
Home Financials are based on the most recent Mortgage that was taken out on this home.
Original Mortgage
$236,882
Interest Rate
3.74%
Mortgage Type
New Conventional
Purchase Details
Closed on
Jan 9, 2012
Sold by
Weng Fuliang and Liu Jane
Bought by
Weng Fuliang and Liu Jane
Home Financials for this Owner
Home Financials are based on the most recent Mortgage that was taken out on this home.
Original Mortgage
$240,000
Interest Rate
3.93%
Mortgage Type
New Conventional
Purchase Details
Closed on
Sep 2, 2011
Sold by
Weng Fuliang and Liu Jane
Bought by
Weng Fuliang and Liu Jane
Home Financials for this Owner
Home Financials are based on the most recent Mortgage that was taken out on this home.
Original Mortgage
$241,600
Interest Rate
4.48%
Mortgage Type
New Conventional
Purchase Details
Closed on
Nov 17, 2010
Sold by
Weng Fuliang and Liu Jane
Bought by
Weng Fuliang and Liu Jane
Home Financials for this Owner
Home Financials are based on the most recent Mortgage that was taken out on this home.
Original Mortgage
$250,000
Interest Rate
4.23%
Mortgage Type
New Conventional
Purchase Details
Closed on
Jun 4, 2010
Sold by
Weng Fuliang and Liu Jane
Bought by
Weng Fuliang and Liu Jane
Home Financials for this Owner
Home Financials are based on the most recent Mortgage that was taken out on this home.
Original Mortgage
$300,000
Interest Rate
5.03%
Mortgage Type
New Conventional
Purchase Details
Closed on
Feb 6, 2010
Sold by
Weng Fuliang and Liu Jane
Bought by
Weng Fuliang and Liu Jane
Purchase Details
Closed on
May 5, 2003
Sold by
Stiles Roger W and Stiles Janet A
Bought by
Weng Fuliang and Liu Jia
Home Financials for this Owner
Home Financials are based on the most recent Mortgage that was taken out on this home.
Original Mortgage
$433,300
Interest Rate
4.12%
Mortgage Type
Purchase Money Mortgage
Create a Home Valuation Report for This Property
The Home Valuation Report is an in-depth analysis detailing your home's value as well as a comparison with similar homes in the area
Home Values in the Area
Average Home Value in this Area
Purchase History
| Date | Buyer | Sale Price | Title Company |
|---|---|---|---|
| Weng Fuliang | -- | Chicago Title | |
| Weng Fuliang | -- | Chicago Title Company | |
| Weng Fuliang | -- | Stewart Title Of California | |
| Weng Fuliang | -- | Stewart Title Of California | |
| Weng Fuliang | -- | Chicago Title Company | |
| Weng Fuliang | -- | Chicago Title Company | |
| Weng Fuliang | -- | Accommodation | |
| Weng Fuliang | -- | Chicago Title Company | |
| Weng Fuliang | -- | Accommodation | |
| Weng Fuliang | -- | Chicago Title Company | |
| Weng Fuliang | -- | Accommodation | |
| Weng Fuliang | -- | Chicago Title Company | |
| Weng Fuliang | -- | None Available | |
| Weng Fuliang | -- | None Available | |
| Weng Fuliang | $619,000 | North American Title Company |
Source: Public Records
Mortgage History
| Date | Status | Borrower | Loan Amount |
|---|---|---|---|
| Closed | Weng Fuliang | $220,000 | |
| Closed | Weng Fuliang | $236,882 | |
| Closed | Weng Fuliang | $240,000 | |
| Closed | Weng Fuliang | $241,600 | |
| Closed | Weng Fuliang | $250,000 | |
| Closed | Weng Fuliang | $300,000 | |
| Closed | Weng Fuliang | $433,300 |
Source: Public Records
Tax History
| Year | Tax Paid | Tax Assessment Tax Assessment Total Assessment is a certain percentage of the fair market value that is determined by local assessors to be the total taxable value of land and additions on the property. | Land | Improvement |
|---|---|---|---|---|
| 2025 | $12,245 | $1,017,484 | $627,553 | $389,931 |
| 2024 | $12,245 | $997,535 | $615,249 | $382,286 |
| 2023 | $12,042 | $977,977 | $603,186 | $374,791 |
| 2022 | $11,948 | $958,802 | $591,359 | $367,443 |
| 2021 | $12,009 | $940,003 | $579,764 | $360,239 |
| 2020 | $12,100 | $930,366 | $573,820 | $356,546 |
| 2019 | $11,534 | $912,124 | $562,569 | $349,555 |
| 2018 | $11,421 | $894,240 | $551,539 | $342,701 |
| 2017 | $11,002 | $876,707 | $540,725 | $335,982 |
| 2016 | $10,726 | $859,518 | $530,123 | $329,395 |
| 2015 | $9,459 | $750,081 | $522,161 | $227,920 |
| 2014 | $9,358 | $735,389 | $511,933 | $223,456 |
Source: Public Records
Map
Nearby Homes
- 948 Rincon St
- 956 Trophy Dr
- 943 Trophy Dr
- 1734 W El Camino Real Unit 7
- 1006 Judson Dr
- 938 Clark Ave Unit 50
- 1910 Mount Vernon Ct Unit 10
- 1945 Mount Vernon Ct Unit 3
- 1515 Miramonte Ave
- 1940 Mount Vernon Ct Unit 1
- 328 Higdon Ave
- 551 Hawthorne Ct
- 236 Higdon Ave
- 613 Paco Dr
- 5100 El Camino Real Unit 108
- 5100 El Camino Real Unit 209
- 172 Permanente Way
- 556 S Rengstorff Ave
- 554 S Rengstorff Ave
- 100 W El Camino Real Unit 40
- 1465 Lloyd Way
- 1491 Lloyd Way
- 1482 Ernestine Ln
- 1474 Ernestine Ln
- 1494 Ernestine Ln
- 1453 Lloyd Way
- 1501 Lloyd Way
- 1190 Kathy Way
- 1458 Ernestine Ln
- 1502 Ernestine Ln
- 1496 Lloyd Way
- 1450 Lloyd Way
- 1441 Lloyd Way
- 1517 Lloyd Way
- 1504 Lloyd Way
- 1446 Ernestine Ln
- 1516 Ernestine Ln
- 1438 Lloyd Way
- 1182 Kathy Way
- 1170 Kathy Way
Your Personal Tour Guide
Ask me questions while you tour the home.