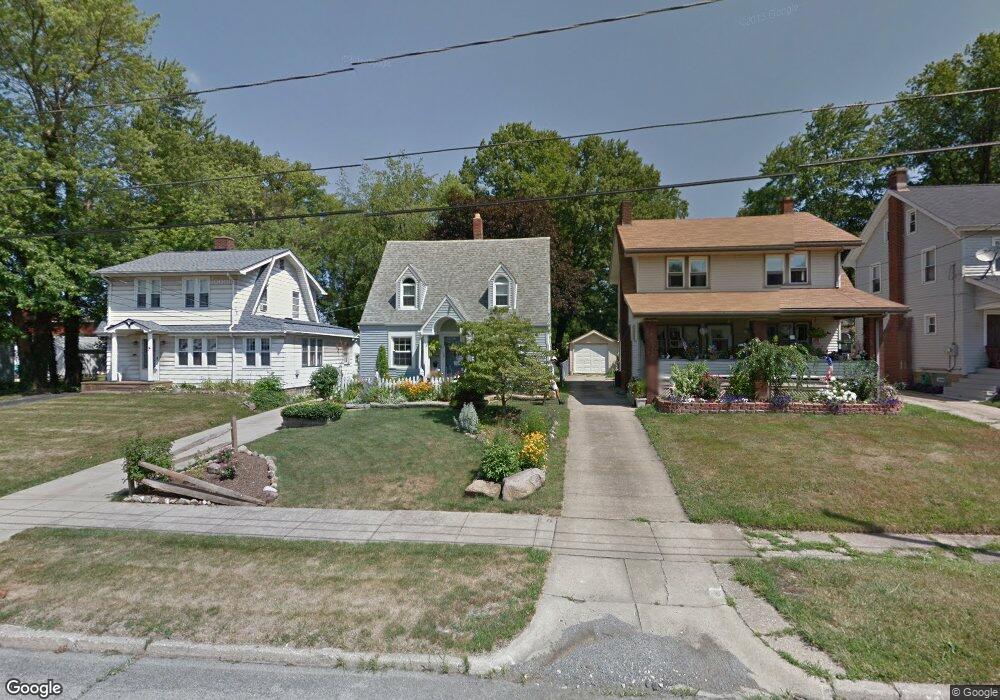
148 Maple Dr Youngstown, OH 44512
Estimated Value: $99,000 - $117,000
3
Beds
1
Bath
1,117
Sq Ft
$97/Sq Ft
Est. Value
About This Home
This home is located at 148 Maple Dr, Youngstown, OH 44512 and is currently estimated at $108,567, approximately $97 per square foot. 148 Maple Dr is a home located in Mahoning County with nearby schools including Boardman Glenwood Junior High School, Boardman High School, and Horizon Science Academy - Youngstown.
Ownership History
Date
Name
Owned For
Owner Type
Purchase Details
Closed on
Feb 26, 2001
Sold by
Williams Robyn L and Williams Ronald E
Bought by
Williams Ronald E and Williams Robyn L
Current Estimated Value
Purchase Details
Closed on
Jul 11, 1997
Sold by
Gump Bryan P and Gump Jodi C
Bought by
Morrow Robyn Lynn
Home Financials for this Owner
Home Financials are based on the most recent Mortgage that was taken out on this home.
Original Mortgage
$52,600
Outstanding Balance
$6,184
Interest Rate
8%
Estimated Equity
$102,383
Purchase Details
Closed on
Aug 22, 1994
Sold by
Stanton William L
Bought by
Gump Bryan P
Home Financials for this Owner
Home Financials are based on the most recent Mortgage that was taken out on this home.
Original Mortgage
$53,483
Interest Rate
7.25%
Mortgage Type
New Conventional
Purchase Details
Closed on
Dec 20, 1990
Bought by
Stanton Wm L and Stanton Mary C
Create a Home Valuation Report for This Property
The Home Valuation Report is an in-depth analysis detailing your home's value as well as a comparison with similar homes in the area
Home Values in the Area
Average Home Value in this Area
Purchase History
| Date | Buyer | Sale Price | Title Company |
|---|---|---|---|
| Williams Ronald E | -- | -- | |
| Williams Ronald E | -- | -- | |
| Morrow Robyn Lynn | $58,500 | -- | |
| Gump Bryan P | $57,500 | -- | |
| Stanton Wm L | -- | -- |
Source: Public Records
Mortgage History
| Date | Status | Borrower | Loan Amount |
|---|---|---|---|
| Open | Morrow Robyn Lynn | $52,600 | |
| Previous Owner | Gump Bryan P | $53,483 |
Source: Public Records
Tax History
| Year | Tax Paid | Tax Assessment Tax Assessment Total Assessment is a certain percentage of the fair market value that is determined by local assessors to be the total taxable value of land and additions on the property. | Land | Improvement |
|---|---|---|---|---|
| 2025 | $1,330 | $25,580 | $3,120 | $22,460 |
| 2024 | $1,360 | $25,580 | $3,120 | $22,460 |
| 2023 | $1,313 | $25,580 | $3,120 | $22,460 |
| 2022 | $1,153 | $17,100 | $3,020 | $14,080 |
| 2021 | $1,154 | $17,100 | $3,020 | $14,080 |
| 2020 | $1,160 | $17,100 | $3,020 | $14,080 |
| 2019 | $1,186 | $15,130 | $2,670 | $12,460 |
| 2018 | $987 | $15,130 | $2,670 | $12,460 |
| 2017 | $972 | $15,130 | $2,670 | $12,460 |
| 2016 | $1,085 | $16,750 | $3,190 | $13,560 |
| 2015 | $1,063 | $16,750 | $3,190 | $13,560 |
| 2014 | $1,066 | $16,750 | $3,190 | $13,560 |
| 2013 | $1,053 | $16,750 | $3,190 | $13,560 |
Source: Public Records
Map
Nearby Homes
- 189 Beechwood Dr
- 138 Clifton Dr
- 196 Maywood Dr
- 4803 Southern Blvd Unit 805
- 4418 Rush Blvd
- 173 Terrace Dr
- 4127 Southern Blvd
- 63 Clifton Dr
- 4144 Helena Ave
- 4206 Rush Blvd
- 192 Hollywood Ave
- 55 Terrace Dr
- 28 Terrace Dr
- 4717 Market St
- 173 Clarencedale Ave
- 28 Jennette Dr
- 4941 Market St
- 252 Indianola Rd
- 21 Vermont Ave
- 94 Jennette Dr
Your Personal Tour Guide
Ask me questions while you tour the home.