C
Seller's Agent in 2021
Cathy Gill
Prestige Luxury Realty

Estimated Value: $250,612 - $272,000
NEW AFFORDABLE FLOOD POLICY!!!!
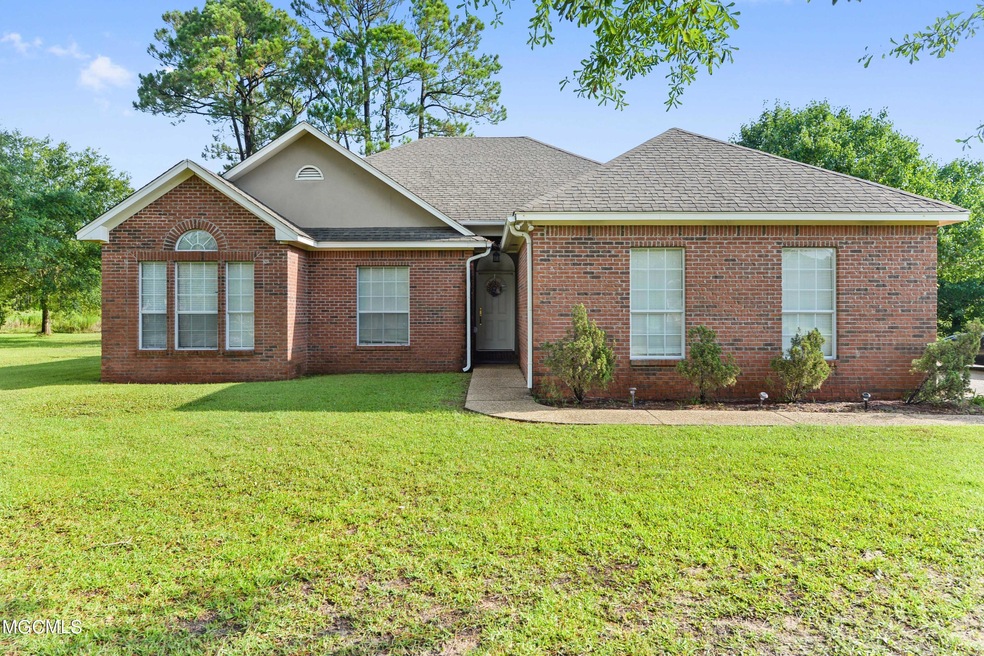
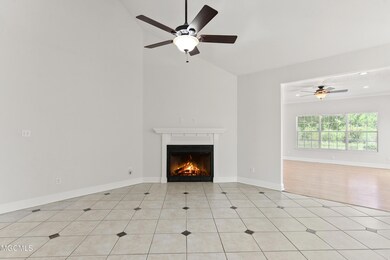
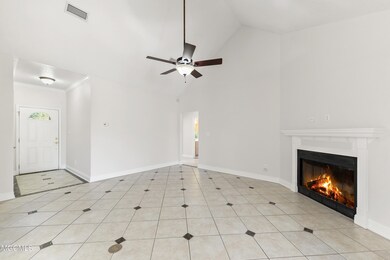
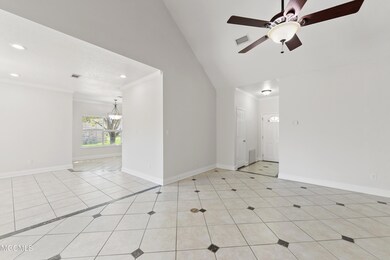
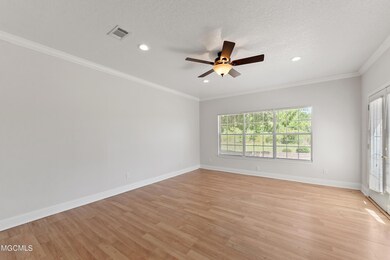
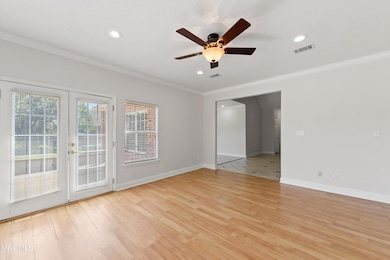
Fantastic home in the sought after neighborhood of Porteaux Bay!! This home sits on a .38 acre lot with a huge backyard and a nice patio. Spacious floor plan includes a living room with 12 foot ceiling, fire place. and a large den. Enjoy family meals in your eat in kitchen featuring stainless steel appliances, granite countertops, and lots of cabinets. There are 3 bedrooms and 2 bathrooms, the master bedroom is huge!!! Entire house has been freshly painted!!! This home is 8.2 miles from Keesler AFB and less than 5 minutes to shopping, casinos, and beaches!!!
Last Agent to Sell the Property
Cathy Gill
Prestige Luxury Realty Listed on: 06/25/2021
| Date | Buyer | Sale Price | Title Company |
|---|---|---|---|
| Barnes Chris S | -- | New Title Company Name | |
| Barnes Chris S | -- | New Title Company Name | |
| Cabinetsource Inc | -- | None Available | |
| Trippe Sharon | -- | -- |
| Date | Status | Borrower | Loan Amount |
|---|---|---|---|
| Closed | Barnes Chris S | $235,000 |
| Date | Event | Price | List to Sale | Price per Sq Ft |
|---|---|---|---|---|
| 12/30/2021 12/30/21 | Sold | -- | -- | -- |
| 11/20/2021 11/20/21 | Pending | -- | -- | -- |
| 06/25/2021 06/25/21 | For Sale | $249,000 | -- | $115 / Sq Ft |
| Year | Tax Paid | Tax Assessment Tax Assessment Total Assessment is a certain percentage of the fair market value that is determined by local assessors to be the total taxable value of land and additions on the property. | Land | Improvement |
|---|---|---|---|---|
| 2025 | -- | $13,659 | $1,269 | $12,390 |
| 2024 | $1,302 | $13,146 | $1,230 | $11,916 |
| 2023 | $1,302 | $13,146 | $1,230 | $11,916 |
| 2022 | $1,259 | $13,146 | $1,230 | $11,916 |
| 2021 | $2,349 | $19,806 | $1,845 | $17,961 |
| 2020 | $2,252 | $18,283 | $1,913 | $16,370 |
| 2019 | $2,229 | $18,283 | $1,913 | $16,370 |
| 2018 | $2,271 | $18,283 | $1,913 | $16,370 |
| 2017 | $2,584 | $20,456 | $1,913 | $18,543 |
| 2016 | $2,490 | $20,510 | $2,984 | $17,526 |
| 2015 | $2,223 | $121,340 | $21,490 | $99,850 |
| 2014 | $2,248 | $18,737 | $3,224 | $15,513 |
| 2013 | $2,175 | $18,737 | $3,224 | $15,513 |
C
Seller's Agent in 2021
Cathy Gill
Prestige Luxury Realty

Buyer's Agent in 2021
Latrell Price
L Price Real Estate LLC
(757) 218-1089
1 in this area
25 Total Sales
Source: MLS United
MLS Number: 3376847
APN: 0-63-48-002.000
Disclaimer: Certain information contained herein is derived from information provided by parties other than Homes.com. All information provided is deemed reliable, but is not guaranteed to be accurate and should be independently verified.
![]() Information is deemed to be reliable but not guaranteed. Copyright 2026 MLS United, LLC.
Information is deemed to be reliable but not guaranteed. Copyright 2026 MLS United, LLC.
Ask me questions while you tour the home.