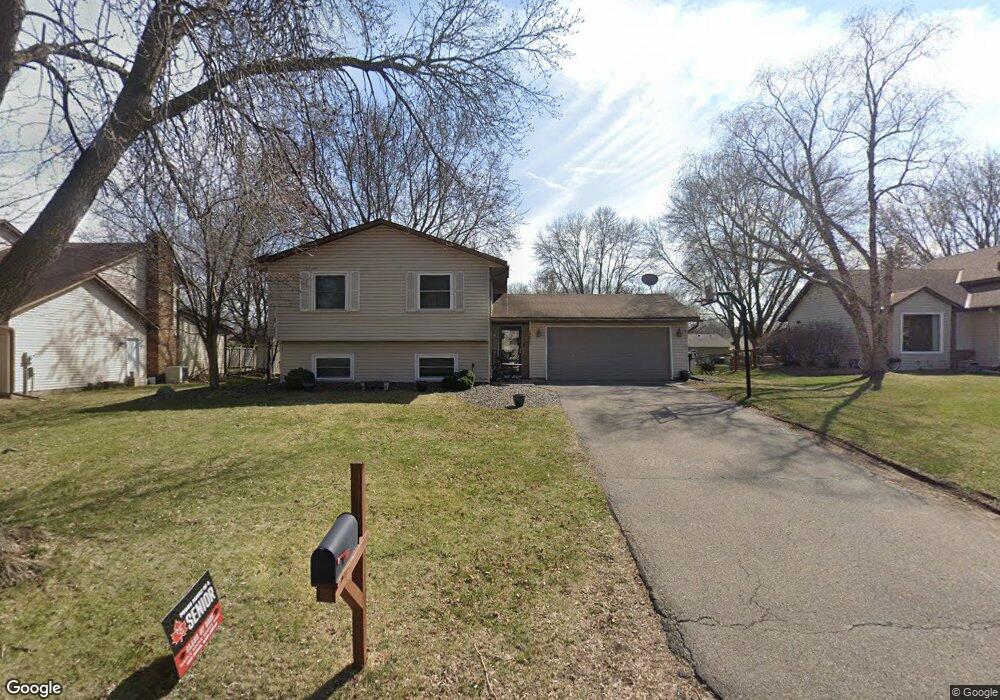
14873 95th Place N Maple Grove, MN 55369
Estimated Value: $402,000 - $420,000
4
Beds
2
Baths
1,122
Sq Ft
$367/Sq Ft
Est. Value
About This Home
This home is located at 14873 95th Place N, Maple Grove, MN 55369 and is currently estimated at $412,213, approximately $367 per square foot. 14873 95th Place N is a home located in Hennepin County with nearby schools including Fernbrook Elementary School, Osseo Middle School, and Maple Grove Senior High School.
Ownership History
Date
Name
Owned For
Owner Type
Purchase Details
Closed on
Jun 10, 2016
Sold by
Hopfer Michele R and Hopfer Jason S
Bought by
Renken Lindsey and Renken Matthew
Current Estimated Value
Home Financials for this Owner
Home Financials are based on the most recent Mortgage that was taken out on this home.
Original Mortgage
$255,290
Outstanding Balance
$202,718
Interest Rate
3.5%
Mortgage Type
FHA
Estimated Equity
$209,495
Purchase Details
Closed on
Apr 23, 2009
Sold by
Mcgovern Sadusky Investments
Bought by
Hopfer Michele R and Hopfer Jason S
Purchase Details
Closed on
May 19, 2006
Sold by
Jackson Jeffrey S and Jackson Angela S
Bought by
Kollasch Michael A
Create a Home Valuation Report for This Property
The Home Valuation Report is an in-depth analysis detailing your home's value as well as a comparison with similar homes in the area
Home Values in the Area
Average Home Value in this Area
Purchase History
| Date | Buyer | Sale Price | Title Company |
|---|---|---|---|
| Renken Lindsey | $260,000 | Liberty Title Inc | |
| Hopfer Michele R | $206,400 | -- | |
| Kollasch Michael A | $255,000 | -- |
Source: Public Records
Mortgage History
| Date | Status | Borrower | Loan Amount |
|---|---|---|---|
| Open | Renken Lindsey | $255,290 |
Source: Public Records
Tax History Compared to Growth
Tax History
| Year | Tax Paid | Tax Assessment Tax Assessment Total Assessment is a certain percentage of the fair market value that is determined by local assessors to be the total taxable value of land and additions on the property. | Land | Improvement |
|---|---|---|---|---|
| 2024 | $4,375 | $370,300 | $119,500 | $250,800 |
| 2023 | $4,313 | $370,800 | $112,000 | $258,800 |
| 2022 | $3,716 | $377,700 | $104,500 | $273,200 |
| 2021 | $3,636 | $313,600 | $78,100 | $235,500 |
| 2020 | $3,687 | $302,700 | $73,300 | $229,400 |
| 2019 | $3,514 | $278,700 | $61,200 | $217,500 |
| 2018 | $3,306 | $265,800 | $59,000 | $206,800 |
| 2017 | $3,324 | $239,700 | $62,000 | $177,700 |
| 2016 | $3,241 | $231,500 | $59,000 | $172,500 |
| 2015 | $3,114 | $218,100 | $57,000 | $161,100 |
| 2014 | -- | $198,200 | $52,000 | $146,200 |
Source: Public Records
Map
Nearby Homes
- 14878 95th Place N
- 9536 Minnesota Ln N
- 14661 94th Place N
- 14624 92nd Place N
- 9340 Ranchview Ln N
- 10625 Juneau Ln N
- 9421 Dallas Ln N
- 14402 91st Place N
- 13885 93rd Place N
- 13744 94th Ave N
- 9828 Zinnia Ln N
- 9228 Archer Ln N
- 14420 103rd Place N
- 14444 103rd Place
- 14452 103rd Place N
- 14460 103rd Place N
- 10385 Glacier Ln N
- 9190 Archer Ln N
- 13391 Territorial Cir N
- 13485 Territorial Cir N
- 14847 95th Place N
- 14901 95th Place N
- 14894 95th Ave N
- 14872 95th Ave N
- 14872 14872 95th-Avenue-n
- 14922 95th Ave N
- 14929 95th Place N
- 14825 95th Place N
- 14848 95th Ave N
- 14850 95th Place N
- 14948 95th Ave N
- 14904 95th Place N
- 14826 95th Place N
- 14953 95th Place N
- 14932 95th Place N
- 14976 95th Ave N
- 14891 95th Ave N
- 14869 95th Ave N
- 14919 95th Ave N
- 9536 Kingsview Ln N