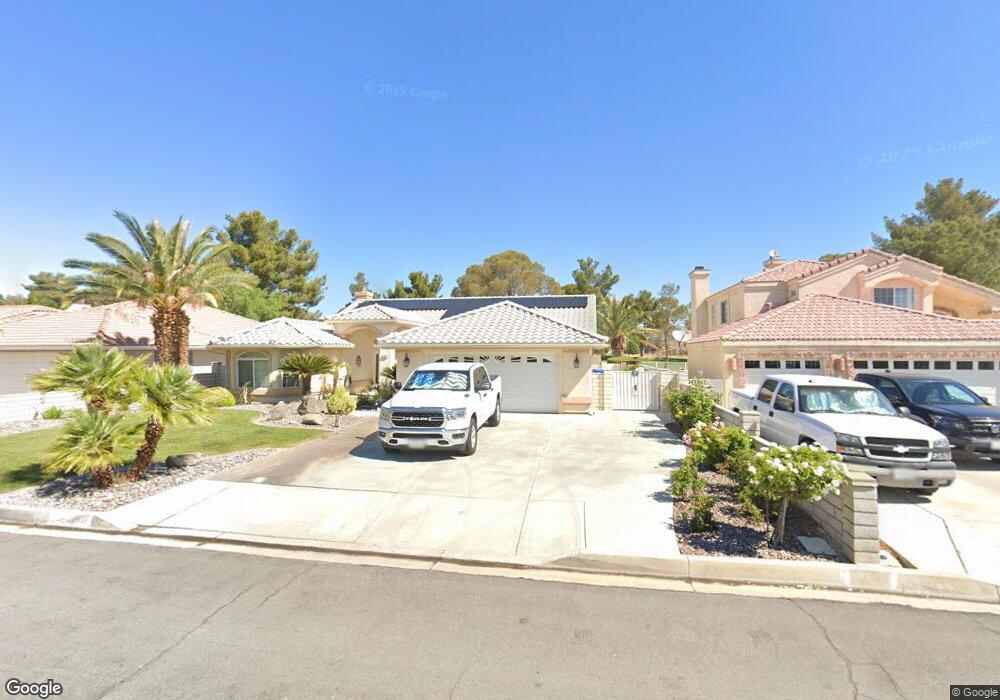
14882 Blue Grass Dr Helendale, CA 92342
Estimated Value: $427,616 - $559,000
3
Beds
2
Baths
2,143
Sq Ft
$224/Sq Ft
Est. Value
About This Home
This home is located at 14882 Blue Grass Dr, Helendale, CA 92342 and is currently estimated at $480,904, approximately $224 per square foot. 14882 Blue Grass Dr is a home with nearby schools including Helendale Elementary School, Riverview Middle School, and Adelanto High School.
Ownership History
Date
Name
Owned For
Owner Type
Purchase Details
Closed on
Sep 22, 2023
Sold by
Wenzel David William and Wenzel Sharon Joy
Bought by
Wenzel Family Trust and Wenzel
Current Estimated Value
Purchase Details
Closed on
Nov 3, 2022
Sold by
Peter H Kuizin H and Peter Sandra L
Bought by
Wenzel David William and Wenzel Sharon Joy
Home Financials for this Owner
Home Financials are based on the most recent Mortgage that was taken out on this home.
Original Mortgage
$200,000
Interest Rate
6.95%
Purchase Details
Closed on
Aug 23, 2004
Sold by
Kuizin Peter H
Bought by
Kuizin Peter H and Kuizin Sandra L
Purchase Details
Closed on
Jul 9, 2001
Sold by
Mcnary Janet L
Bought by
Kuizin Peter H and Kuizin Sandra L
Purchase Details
Closed on
Jun 19, 1996
Sold by
Hancock Joseph L
Bought by
Hancock Joseph L and Hancock Mary A
Create a Home Valuation Report for This Property
The Home Valuation Report is an in-depth analysis detailing your home's value as well as a comparison with similar homes in the area
Home Values in the Area
Average Home Value in this Area
Purchase History
| Date | Buyer | Sale Price | Title Company |
|---|---|---|---|
| Wenzel Family Trust | -- | None Listed On Document | |
| Wenzel David William | $397,000 | First American Title | |
| Kuizin Peter H | -- | -- | |
| Kuizin Peter H | $26,000 | Lawyers Title Company | |
| Hancock Joseph L | -- | -- |
Source: Public Records
Mortgage History
| Date | Status | Borrower | Loan Amount |
|---|---|---|---|
| Previous Owner | Wenzel David William | $200,000 |
Source: Public Records
Tax History Compared to Growth
Tax History
| Year | Tax Paid | Tax Assessment Tax Assessment Total Assessment is a certain percentage of the fair market value that is determined by local assessors to be the total taxable value of land and additions on the property. | Land | Improvement |
|---|---|---|---|---|
| 2025 | $4,979 | $413,039 | $82,192 | $330,847 |
| 2024 | $4,979 | $404,940 | $80,580 | $324,360 |
| 2023 | $5,021 | $397,000 | $79,000 | $318,000 |
| 2022 | $3,431 | $270,941 | $36,194 | $234,747 |
| 2021 | $3,366 | $265,628 | $35,484 | $230,144 |
| 2020 | $3,302 | $262,904 | $35,120 | $227,784 |
| 2019 | $3,267 | $257,749 | $34,431 | $223,318 |
| 2018 | $3,398 | $252,695 | $33,756 | $218,939 |
| 2017 | $3,157 | $247,740 | $33,094 | $214,646 |
| 2016 | $3,121 | $242,882 | $32,445 | $210,437 |
| 2015 | $2,958 | $239,234 | $31,958 | $207,276 |
| 2014 | $2,813 | $218,600 | $40,300 | $178,300 |
Source: Public Records
Map
Nearby Homes
- 14740 Blue Grass Dr
- 27871 Jasmine Ln
- 15047 Blue Grass Dr
- 14785 Blue Grass Dr
- 14759 Blue Grass Dr
- 14989 Blue Grass Dr
- 14743 Blue Grass Dr
- 14753 Blue Grass Dr
- 15103 Tournament Dr
- 14907 Tournament Dr
- 14805 Greenbriar Dr
- 14714 Robin Ln
- 15114 Tournament Dr
- 14702 Robin Ln
- 27853 Evergreen Ln
- 15163 Blue Grass Dr
- 15143 Tournament Dr
- 15171 Blue Grass Dr
- 27754 Hummingbird Ln
- 14666 Echo Ln
- 14872 Bluegrass Dr
- 14872 Blue Grass Dr
- 14894 Blue Grass Dr
- 14864 Blue Grass Dr
- 14902 Blue Grass Dr
- 14883 Blue Grass Dr
- 14873 Blue Grass Dr
- 14893 Blue Grass Dr
- 14912 Blue Grass Dr
- 14863 Blue Grass Dr
- 14844 Blue Grass Dr
- 14913 Blue Grass Dr
- 14922 Blue Grass Dr
- 14853 Blue Grass Dr
- 14923 Blue Grass Dr
- 14834 Blue Grass Dr
- 14843 Blue Grass Dr
- 14932 Blue Grass Dr
- 14903 Blue Grass Dr
- 14933 Blue Grass Dr