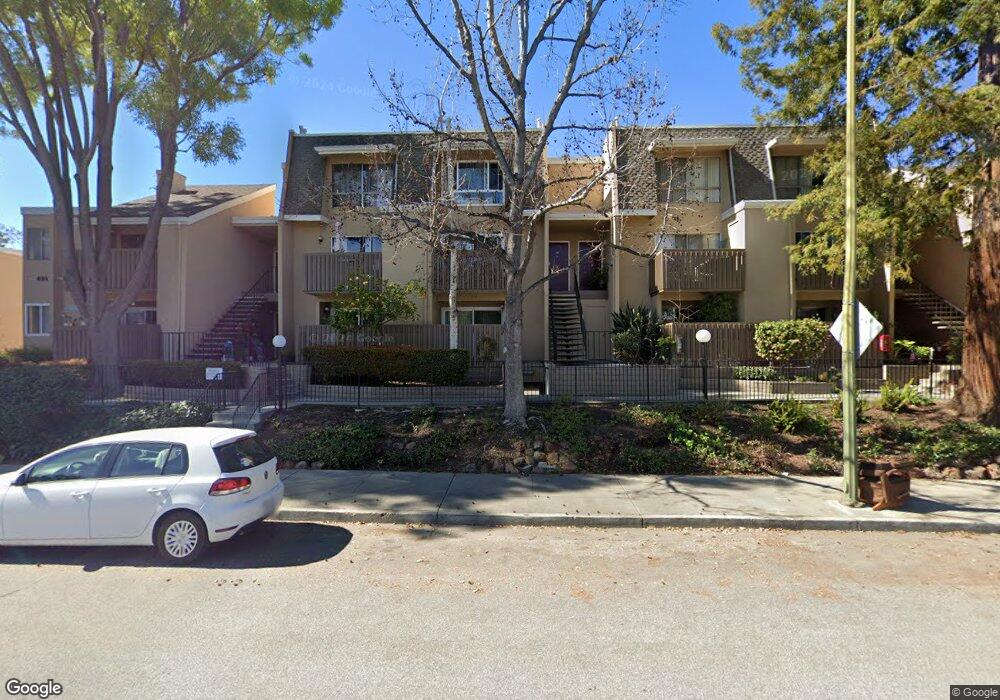
1489 De Rose Way Unit 105 San Jose, CA 95126
Willow Glen NeighborhoodEstimated Value: $635,348 - $700,000
2
Beds
1
Bath
966
Sq Ft
$696/Sq Ft
Est. Value
About This Home
This home is located at 1489 De Rose Way Unit 105, San Jose, CA 95126 and is currently estimated at $672,087, approximately $695 per square foot. 1489 De Rose Way Unit 105 is a home located in Santa Clara County with nearby schools including Del Mar High School, Blackford Elementary, and Sherman Oaks Elementary School.
Ownership History
Date
Name
Owned For
Owner Type
Purchase Details
Closed on
Dec 11, 2017
Sold by
Tsz Wong Denise Choi
Bought by
Tsz Wong Denise Choi and The Polanco And Wong Family Li
Current Estimated Value
Purchase Details
Closed on
Jul 21, 2011
Sold by
Wong Denise Choi Tsz
Bought by
Wong Denise Chio Tsz
Purchase Details
Closed on
Sep 13, 2010
Sold by
Nail Carl and Nail Gwen L
Bought by
Wong Denise C
Home Financials for this Owner
Home Financials are based on the most recent Mortgage that was taken out on this home.
Original Mortgage
$178,500
Outstanding Balance
$117,329
Interest Rate
4.35%
Mortgage Type
New Conventional
Estimated Equity
$554,758
Purchase Details
Closed on
Aug 18, 1997
Sold by
Virginia Freitas
Bought by
Nail Carl and Nail Gwen L
Home Financials for this Owner
Home Financials are based on the most recent Mortgage that was taken out on this home.
Original Mortgage
$144,000
Interest Rate
7.43%
Mortgage Type
VA
Create a Home Valuation Report for This Property
The Home Valuation Report is an in-depth analysis detailing your home's value as well as a comparison with similar homes in the area
Home Values in the Area
Average Home Value in this Area
Purchase History
| Date | Buyer | Sale Price | Title Company |
|---|---|---|---|
| Tsz Wong Denise Choi | -- | None Available | |
| Tsz Wong Denise Choi | -- | None Available | |
| Wong Denise Chio Tsz | -- | None Available | |
| Wong Denise C | $238,000 | Cornerstone Title Company | |
| Nail Carl | $144,000 | Chicago Title Co |
Source: Public Records
Mortgage History
| Date | Status | Borrower | Loan Amount |
|---|---|---|---|
| Open | Wong Denise C | $178,500 | |
| Previous Owner | Nail Carl | $144,000 |
Source: Public Records
Tax History Compared to Growth
Tax History
| Year | Tax Paid | Tax Assessment Tax Assessment Total Assessment is a certain percentage of the fair market value that is determined by local assessors to be the total taxable value of land and additions on the property. | Land | Improvement |
|---|---|---|---|---|
| 2025 | $4,257 | $304,904 | $152,452 | $152,452 |
| 2024 | $4,257 | $298,926 | $149,463 | $149,463 |
| 2023 | $4,171 | $293,066 | $146,533 | $146,533 |
| 2022 | $4,195 | $287,320 | $143,660 | $143,660 |
| 2021 | $4,030 | $281,688 | $140,844 | $140,844 |
| 2020 | $3,953 | $278,800 | $139,400 | $139,400 |
| 2019 | $3,912 | $273,334 | $136,667 | $136,667 |
| 2018 | $3,811 | $267,976 | $133,988 | $133,988 |
| 2017 | $3,763 | $262,722 | $131,361 | $131,361 |
| 2016 | $3,550 | $257,572 | $128,786 | $128,786 |
| 2015 | $3,495 | $253,704 | $126,852 | $126,852 |
| 2014 | $3,315 | $248,736 | $124,368 | $124,368 |
Source: Public Records
Map
Nearby Homes
- 1522 Mckinley Ave
- 1503 Willowhaven Ct
- 960 Lakeshire Ct
- 1515 Rhinecliff Way
- 1492 Aurelian Ln
- 1182 Leigh Ave
- 1751 Willow St
- 1566 Stokes St
- 1785 Santa Barbara Dr
- 1070 Shelton Way
- 803 Corlista Dr
- 1990 Southwest Expy
- 778 Menker Ave
- 800 Leigh Ave
- 1668 Dolores Dr
- 1321 Fruitdale Ave
- 975 Cherry Ave
- 1874 Huxley Ct
- 2043 Sonador Commons
- 2067 Sonador Commons
- 1489 De Rose Way Unit 208
- 1489 De Rose Way Unit 207A
- 1489 De Rose Way Unit 207B
- 1489 De Rose Way Unit 206A
- 1489 De Rose Way Unit 206B
- 1489 De Rose Way Unit 205
- 1489 De Rose Way Unit 108
- 1489 De Rose Way Unit 107
- 1489 De Rose Way Unit 106
- 1491 De Rose Way Unit 203B
- 1491 De Rose Way Unit 102
- 1491 De Rose Way Unit 204
- 1491 De Rose Way Unit 203B
- 1491 De Rose Way Unit 203A
- 1491 De Rose Way Unit 202B
- 1491 De Rose Way Unit 202A
- 1491 De Rose Way Unit 201
- 1491 De Rose Way Unit 104
- 1491 De Rose Way Unit 103
- 1491 De Rose Way Unit 102