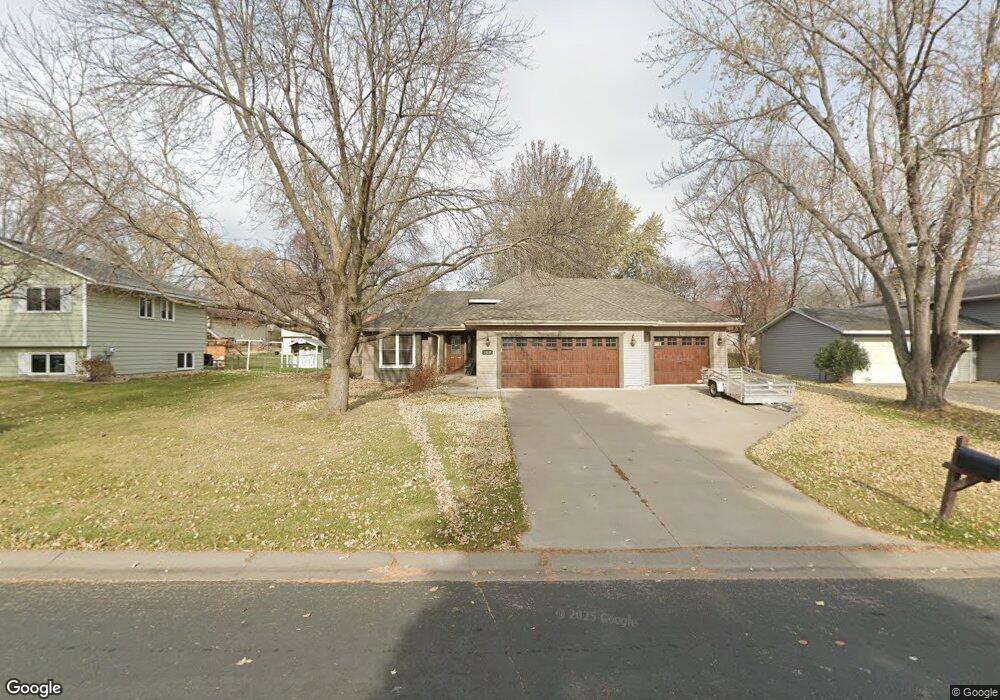
14894 95th Ave N Maple Grove, MN 55369
Estimated Value: $400,875 - $429,000
3
Beds
1
Bath
1,154
Sq Ft
$356/Sq Ft
Est. Value
About This Home
This home is located at 14894 95th Ave N, Maple Grove, MN 55369 and is currently estimated at $410,719, approximately $355 per square foot. 14894 95th Ave N is a home located in Hennepin County with nearby schools including Fernbrook Elementary School, Osseo Middle School, and Maple Grove Senior High School.
Ownership History
Date
Name
Owned For
Owner Type
Purchase Details
Closed on
Sep 9, 2016
Sold by
Mciiveen Keith G and Mciiveen Brenda A
Bought by
Sullivan Jeremy
Current Estimated Value
Home Financials for this Owner
Home Financials are based on the most recent Mortgage that was taken out on this home.
Original Mortgage
$246,900
Outstanding Balance
$197,531
Interest Rate
3.48%
Mortgage Type
New Conventional
Estimated Equity
$213,188
Purchase Details
Closed on
Feb 11, 2011
Sold by
Westphal Ethel L
Bought by
Mcilveen Keith G and Mcilveen Brenda S
Home Financials for this Owner
Home Financials are based on the most recent Mortgage that was taken out on this home.
Original Mortgage
$141,324
Interest Rate
4.62%
Mortgage Type
FHA
Purchase Details
Closed on
Jan 26, 2011
Sold by
Mcllveen Robert W
Bought by
Mciiveen Keith G and Mciiveen Brenda A
Home Financials for this Owner
Home Financials are based on the most recent Mortgage that was taken out on this home.
Original Mortgage
$141,324
Interest Rate
4.62%
Mortgage Type
FHA
Create a Home Valuation Report for This Property
The Home Valuation Report is an in-depth analysis detailing your home's value as well as a comparison with similar homes in the area
Home Values in the Area
Average Home Value in this Area
Purchase History
| Date | Buyer | Sale Price | Title Company |
|---|---|---|---|
| Sullivan Jeremy | $259,900 | Midland Title | |
| Mcilveen Keith G | $145,000 | -- | |
| Mciiveen Keith G | $145,000 | Stewart Title Of Minnesota |
Source: Public Records
Mortgage History
| Date | Status | Borrower | Loan Amount |
|---|---|---|---|
| Open | Sullivan Jeremy | $246,900 | |
| Previous Owner | Mciiveen Keith G | $141,324 |
Source: Public Records
Tax History Compared to Growth
Tax History
| Year | Tax Paid | Tax Assessment Tax Assessment Total Assessment is a certain percentage of the fair market value that is determined by local assessors to be the total taxable value of land and additions on the property. | Land | Improvement |
|---|---|---|---|---|
| 2024 | $4,325 | $366,500 | $118,500 | $248,000 |
| 2023 | $4,239 | $364,900 | $111,000 | $253,900 |
| 2022 | $3,632 | $376,600 | $103,500 | $273,100 |
| 2021 | $3,536 | $307,200 | $77,100 | $230,100 |
| 2020 | $3,436 | $295,200 | $72,300 | $222,900 |
| 2019 | $3,407 | $274,400 | $60,200 | $214,200 |
| 2018 | $3,018 | $258,600 | $58,000 | $200,600 |
| 2017 | $3,093 | $225,000 | $61,000 | $164,000 |
| 2016 | $2,957 | $213,700 | $58,000 | $155,700 |
| 2015 | $2,938 | $207,400 | $56,000 | $151,400 |
| 2014 | -- | $181,300 | $51,000 | $130,300 |
Source: Public Records
Map
Nearby Homes
- 14878 95th Place N
- 9536 Minnesota Ln N
- 14661 94th Place N
- 14624 92nd Place N
- 9340 Ranchview Ln N
- 10625 Juneau Ln N
- 9421 Dallas Ln N
- 14402 91st Place N
- 13885 93rd Place N
- 13744 94th Ave N
- 9828 Zinnia Ln N
- 9228 Archer Ln N
- 9190 Archer Ln N
- 9115 Archer Ln N
- 14420 103rd Place N
- 14444 103rd Place
- 14452 103rd Place N
- 14460 103rd Place N
- 10385 Glacier Ln N
- 13391 Territorial Cir N
- 14922 95th Ave N
- 14872 95th Ave N
- 14872 14872 95th-Avenue-n
- 14873 95th Place N
- 14901 95th Place N
- 14847 95th Place N
- 14948 95th Ave N
- 14848 95th Ave N
- 14891 95th Ave N
- 14919 95th Ave N
- 14929 95th Place N
- 14869 95th Ave N
- 14825 95th Place N
- 14945 95th Ave N
- 14945 14945 95th-Avenue-n
- 14976 95th Ave N
- 14845 95th Ave N
- 14953 95th Place N
- 14973 95th Ave N
- 14892 94th Place N