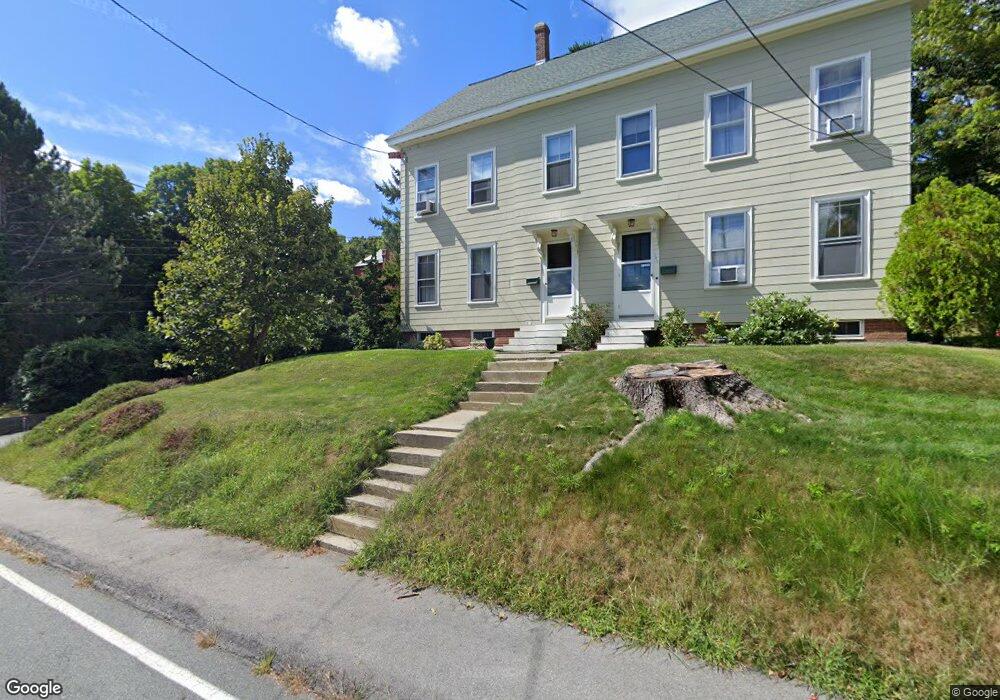
149 Andover St Unit 5 Andover, MA 01810
Ballardvale NeighborhoodEstimated Value: $346,627 - $558,000
1
Bed
1
Bath
711
Sq Ft
$592/Sq Ft
Est. Value
About This Home
This home is located at 149 Andover St Unit 5, Andover, MA 01810 and is currently estimated at $420,907, approximately $591 per square foot. 149 Andover St Unit 5 is a home located in Essex County with nearby schools including South Elementary School, Andover West Middle School, and Andover High School.
Ownership History
Date
Name
Owned For
Owner Type
Purchase Details
Closed on
Sep 12, 2003
Sold by
Walsh Beatrice M
Bought by
Poulo Rebecca A
Current Estimated Value
Home Financials for this Owner
Home Financials are based on the most recent Mortgage that was taken out on this home.
Original Mortgage
$178,400
Interest Rate
6.22%
Mortgage Type
Purchase Money Mortgage
Purchase Details
Closed on
Apr 27, 2001
Sold by
Mckinnon Gary R
Bought by
Walsh Beatrice M
Purchase Details
Closed on
Feb 26, 1999
Sold by
Beaudin Raymond A
Bought by
Mckinnon Gary R
Home Financials for this Owner
Home Financials are based on the most recent Mortgage that was taken out on this home.
Original Mortgage
$108,911
Interest Rate
6.78%
Mortgage Type
Purchase Money Mortgage
Purchase Details
Closed on
Jun 28, 1995
Sold by
Tankin Harry J
Bought by
Beaudin Raymond A
Home Financials for this Owner
Home Financials are based on the most recent Mortgage that was taken out on this home.
Original Mortgage
$73,800
Interest Rate
7.8%
Mortgage Type
Purchase Money Mortgage
Create a Home Valuation Report for This Property
The Home Valuation Report is an in-depth analysis detailing your home's value as well as a comparison with similar homes in the area
Home Values in the Area
Average Home Value in this Area
Purchase History
| Date | Buyer | Sale Price | Title Company |
|---|---|---|---|
| Poulo Rebecca A | $223,000 | -- | |
| Walsh Beatrice M | $155,000 | -- | |
| Mckinnon Gary R | $112,500 | -- | |
| Beaudin Raymond A | $82,000 | -- |
Source: Public Records
Mortgage History
| Date | Status | Borrower | Loan Amount |
|---|---|---|---|
| Open | Beaudin Raymond A | $162,468 | |
| Closed | Poulo Rebecca A | $178,400 | |
| Previous Owner | Beaudin Raymond A | $108,911 | |
| Previous Owner | Beaudin Raymond A | $73,800 |
Source: Public Records
Tax History Compared to Growth
Tax History
| Year | Tax Paid | Tax Assessment Tax Assessment Total Assessment is a certain percentage of the fair market value that is determined by local assessors to be the total taxable value of land and additions on the property. | Land | Improvement |
|---|---|---|---|---|
| 2024 | $3,712 | $288,200 | $0 | $288,200 |
| 2023 | $3,565 | $261,000 | $0 | $261,000 |
| 2022 | $3,673 | $251,600 | $0 | $251,600 |
| 2021 | $4,157 | $271,900 | $0 | $271,900 |
| 2020 | $3,897 | $259,600 | $0 | $259,600 |
| 2019 | $3,617 | $236,900 | $0 | $236,900 |
| 2018 | $3,419 | $218,600 | $0 | $218,600 |
| 2017 | $3,156 | $207,900 | $0 | $207,900 |
| 2016 | $2,945 | $198,700 | $0 | $198,700 |
| 2015 | $2,795 | $186,700 | $0 | $186,700 |
Source: Public Records
Map
Nearby Homes
- 149 Andover St Unit 11
- 149 Andover St Unit 10
- 149 Andover St Unit 9
- 149 Andover St Unit 8
- 149 Andover St Unit 7
- 149 Andover St Unit 6
- 149 Andover St Unit 4
- 149 Andover St Unit 3
- 149 Andover St Unit 2
- 149 Andover St Unit 1
- 149 Andover St Unit 6,149
- 149 Andover St Unit 9 149
- 143 Andover St Unit 145
- 14 Hall Ave
- 151 Andover St
- 150 Andover St
- 16 Hall Ave
- 153 Andover St Unit 155
- 15 Clark Rd
- 139 Andover St