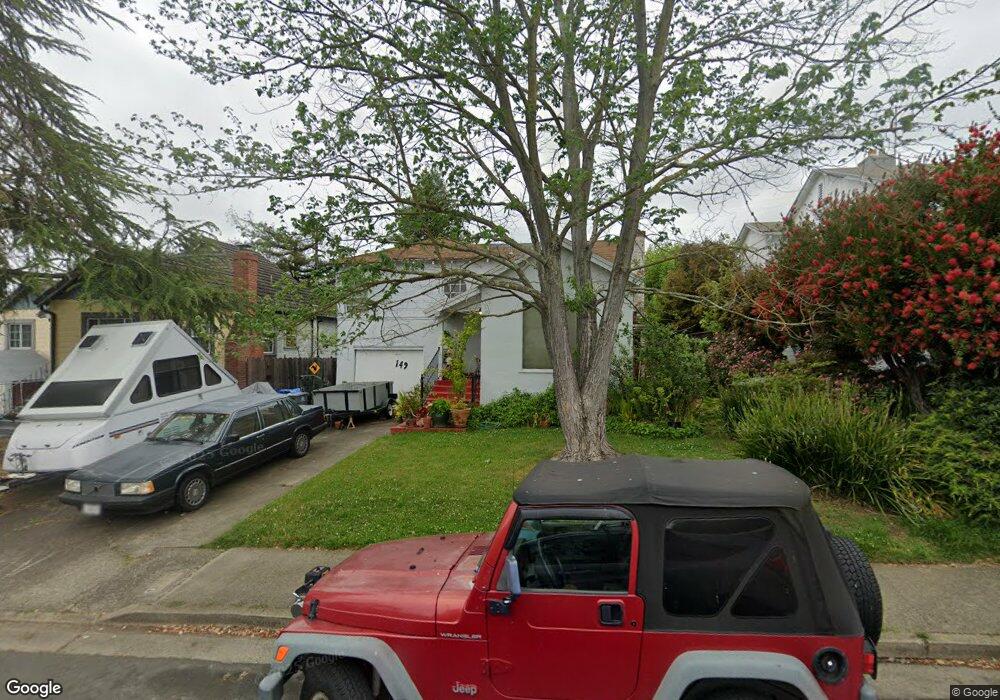
149 Edgemont Ave Vallejo, CA 94590
West Vallejo NeighborhoodEstimated Value: $376,729 - $553,000
2
Beds
1
Bath
996
Sq Ft
$477/Sq Ft
Est. Value
About This Home
This home is located at 149 Edgemont Ave, Vallejo, CA 94590 and is currently estimated at $474,932, approximately $476 per square foot. 149 Edgemont Ave is a home located in Solano County with nearby schools including Highland Elementary, Vallejo High School, and Caliber: ChangeMakers Academy.
Ownership History
Date
Name
Owned For
Owner Type
Purchase Details
Closed on
Jun 20, 2005
Sold by
Cook B Lewis
Bought by
Cook B Lewis
Current Estimated Value
Create a Home Valuation Report for This Property
The Home Valuation Report is an in-depth analysis detailing your home's value as well as a comparison with similar homes in the area
Home Values in the Area
Average Home Value in this Area
Purchase History
| Date | Buyer | Sale Price | Title Company |
|---|---|---|---|
| Cook B Lewis | -- | -- |
Source: Public Records
Tax History
| Year | Tax Paid | Tax Assessment Tax Assessment Total Assessment is a certain percentage of the fair market value that is determined by local assessors to be the total taxable value of land and additions on the property. | Land | Improvement |
|---|---|---|---|---|
| 2025 | $1,756 | $63,820 | $12,861 | $50,959 |
| 2024 | $1,756 | $62,569 | $12,609 | $49,960 |
| 2023 | $1,594 | $61,343 | $12,362 | $48,981 |
| 2022 | $1,750 | $60,141 | $12,120 | $48,021 |
| 2021 | $1,311 | $58,963 | $11,883 | $47,080 |
| 2020 | $1,418 | $58,360 | $11,762 | $46,598 |
| 2019 | $1,279 | $57,217 | $11,532 | $45,685 |
| 2018 | $1,180 | $56,096 | $11,306 | $44,790 |
| 2017 | $1,103 | $54,997 | $11,085 | $43,912 |
| 2016 | $581 | $53,919 | $10,868 | $43,051 |
| 2015 | $573 | $53,110 | $10,705 | $42,405 |
| 2014 | $564 | $52,071 | $10,496 | $41,575 |
Source: Public Records
Map
Nearby Homes
- 187 Fleming Ave
- 168 Fairmont Ave
- 186 Fairmont Ave
- 1041 Highland Ave
- 1078 Calaveras Way
- 135 Bayview Ave
- 725 Valle Vista Ave
- 1408 Arkansas St
- 164 Kathy Ellen Dr
- 15 Monte Vista Ave
- 1441 Arkansas St
- 1839 Illinois St
- 112 Palomar Ln
- 1509 Lassen Ct
- 17 Hanns Ave
- 2 El Camino Real
- 151 Kathy Ellen Ct
- 161 Serra Dr
- 401 Valle Vista Ave
- 241 Howard Ave
- 143 Edgemont Ave
- 137 Edgemont Ave
- 156 Viewmont Ave
- 144 Viewmont Ave
- 158 Viewmont Ave
- 167 Edgemont Ave
- 162 Viewmont Ave
- 138 Viewmont Ave
- 150 Edgemont Ave
- 131 Edgemont Ave
- 156 Edgemont Ave
- 144 Edgemont Ave
- 173 Edgemont Ave
- 168 Viewmont Ave
- 162 Edgemont Ave
- 126 Viewmont Ave
- 168 Edgemont Ave
- 174 Viewmont Ave
- 179 Edgemont Ave
- 174 Edgemont Ave
Your Personal Tour Guide
Ask me questions while you tour the home.