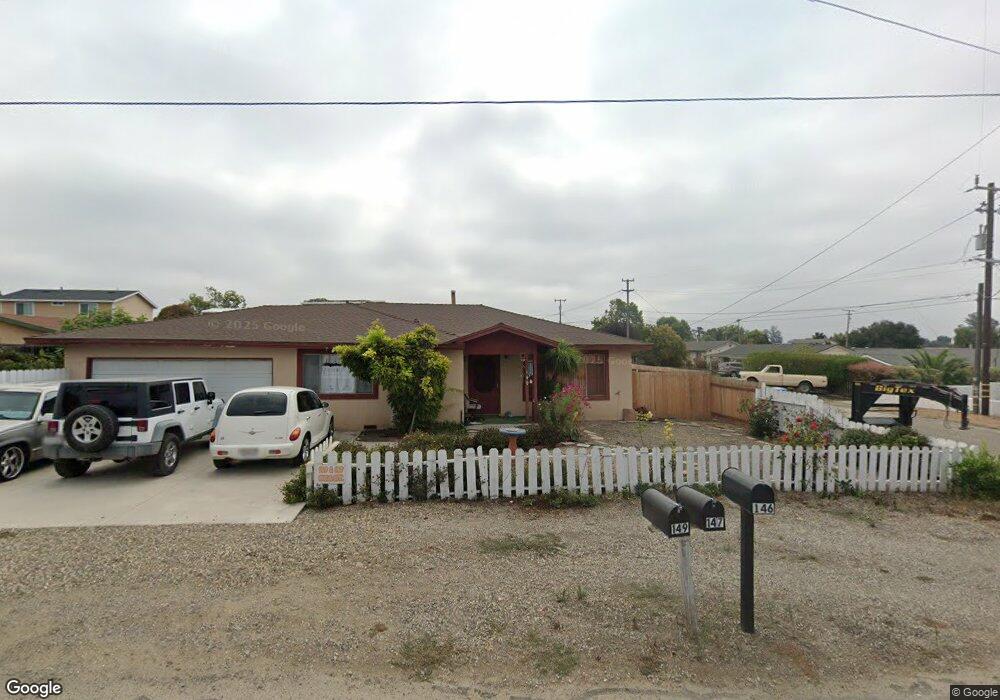
149 Sea St Nipomo, CA 93444
Estimated Value: $656,000 - $790,000
3
Beds
2
Baths
1,344
Sq Ft
$545/Sq Ft
Est. Value
About This Home
This home is located at 149 Sea St, Nipomo, CA 93444 and is currently estimated at $732,000, approximately $544 per square foot. 149 Sea St is a home located in San Luis Obispo County with nearby schools including Nipomo Elementary School, Mesa Middle School, and Nipomo High School.
Ownership History
Date
Name
Owned For
Owner Type
Purchase Details
Closed on
Jun 27, 2022
Sold by
Reyes Alice J
Bought by
Alice J Reyes Revocable Trust
Current Estimated Value
Purchase Details
Closed on
Aug 31, 2001
Sold by
Fox Homer J and Fox Dorlace R
Bought by
Reyes Edward and Reyes Alice J
Create a Home Valuation Report for This Property
The Home Valuation Report is an in-depth analysis detailing your home's value as well as a comparison with similar homes in the area
Home Values in the Area
Average Home Value in this Area
Purchase History
| Date | Buyer | Sale Price | Title Company |
|---|---|---|---|
| Alice J Reyes Revocable Trust | -- | Law Offices Of Johnson Murphy | |
| Reyes Edward | -- | -- |
Source: Public Records
Tax History Compared to Growth
Tax History
| Year | Tax Paid | Tax Assessment Tax Assessment Total Assessment is a certain percentage of the fair market value that is determined by local assessors to be the total taxable value of land and additions on the property. | Land | Improvement |
|---|---|---|---|---|
| 2025 | $1,441 | $147,214 | $13,672 | $133,542 |
| 2024 | $1,423 | $144,328 | $13,404 | $130,924 |
| 2023 | $1,423 | $141,499 | $13,142 | $128,357 |
| 2022 | $1,400 | $138,726 | $12,885 | $125,841 |
| 2021 | $1,396 | $136,007 | $12,633 | $123,374 |
| 2020 | $1,379 | $134,613 | $12,504 | $122,109 |
| 2019 | $1,369 | $131,974 | $12,259 | $119,715 |
| 2018 | $1,351 | $129,387 | $12,019 | $117,368 |
| 2017 | $1,325 | $126,851 | $11,784 | $115,067 |
| 2016 | $1,248 | $124,364 | $11,553 | $112,811 |
| 2015 | $1,229 | $122,497 | $11,380 | $111,117 |
| 2014 | $1,182 | $120,099 | $11,158 | $108,941 |
Source: Public Records
Map
Nearby Homes
- 412 N Mallagh St
- 400 N Oakglen Ave
- 1 W Branch St
- 150 E Chestnut St
- 189 E Tefft St
- 0 S Burton St
- 285 E Tefft St
- 90111003 W Price St
- 160 San Antonio Ln
- 449 W Tefft St Unit 23
- 449 W Tefft St Unit 13
- 255 Encino Ln
- 228 Chaparral Ln
- 230 Hans Place
- 525 Grande Ave Unit D
- 680 Hill St
- 719 W Tefft St
- Mesa Plan at Hill Street Terraces - Hill Street Series
- Pacific Plan at Hill Street Terraces - Hill Street Series
- Monarch Plan at Hill Street Terraces - Hill Street Series