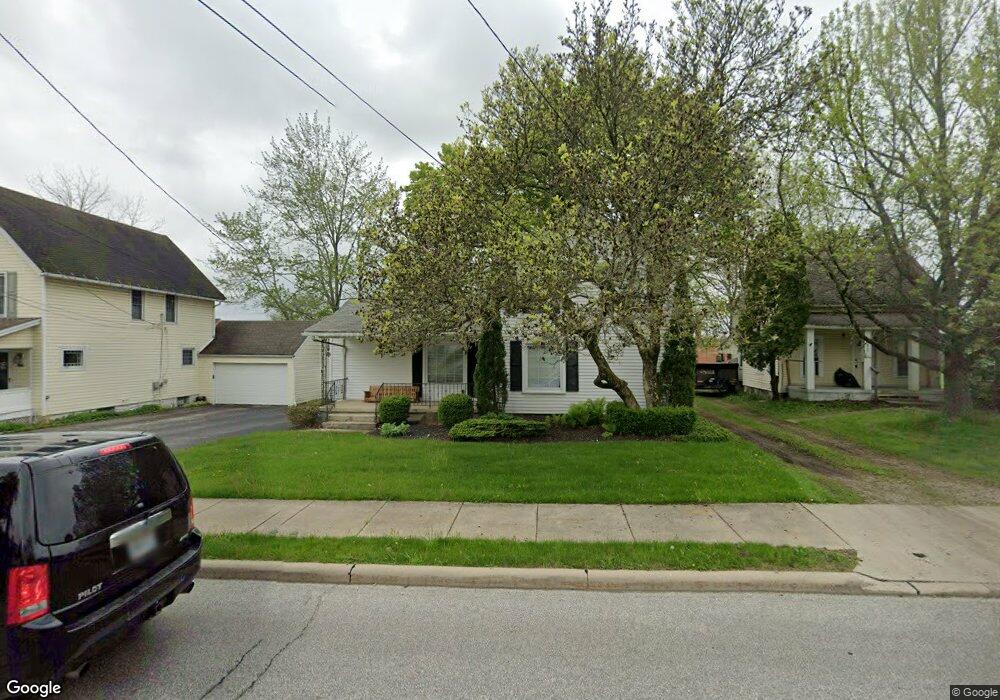
14906 Thompson Ave Middlefield, OH 44062
Estimated Value: $138,000 - $197,000
2
Beds
2
Baths
1,308
Sq Ft
$130/Sq Ft
Est. Value
About This Home
This home is located at 14906 Thompson Ave, Middlefield, OH 44062 and is currently estimated at $170,173, approximately $130 per square foot. 14906 Thompson Ave is a home located in Geauga County with nearby schools including Jordak Elementary School, Cardinal Middle School, and Cardinal High School.
Ownership History
Date
Name
Owned For
Owner Type
Purchase Details
Closed on
May 19, 2022
Sold by
Burton William L
Bought by
Schamberg Sally
Current Estimated Value
Home Financials for this Owner
Home Financials are based on the most recent Mortgage that was taken out on this home.
Original Mortgage
$136,482
Outstanding Balance
$129,655
Interest Rate
5.25%
Mortgage Type
FHA
Estimated Equity
$40,518
Purchase Details
Closed on
Mar 2, 2001
Sold by
Burton William L
Bought by
Ferry Nancy Mae
Home Financials for this Owner
Home Financials are based on the most recent Mortgage that was taken out on this home.
Original Mortgage
$50,000
Interest Rate
6%
Mortgage Type
Stand Alone Second
Purchase Details
Closed on
Feb 12, 1997
Sold by
Burton Julia
Bought by
Burton Julia
Purchase Details
Closed on
Sep 9, 1993
Bought by
Burton Julia and Burton William
Create a Home Valuation Report for This Property
The Home Valuation Report is an in-depth analysis detailing your home's value as well as a comparison with similar homes in the area
Home Values in the Area
Average Home Value in this Area
Purchase History
| Date | Buyer | Sale Price | Title Company |
|---|---|---|---|
| Schamberg Sally | $139,000 | None Listed On Document | |
| Ferry Nancy Mae | -- | -- | |
| Burton Julia | -- | -- | |
| Burton Julia | -- | -- |
Source: Public Records
Mortgage History
| Date | Status | Borrower | Loan Amount |
|---|---|---|---|
| Open | Schamberg Sally | $136,482 | |
| Previous Owner | Ferry Nancy Mae | $50,000 |
Source: Public Records
Tax History
| Year | Tax Paid | Tax Assessment Tax Assessment Total Assessment is a certain percentage of the fair market value that is determined by local assessors to be the total taxable value of land and additions on the property. | Land | Improvement |
|---|---|---|---|---|
| 2024 | $1,635 | $41,830 | $5,010 | $36,820 |
| 2023 | $1,607 | $41,830 | $5,010 | $36,820 |
| 2022 | $1,399 | $30,380 | $4,480 | $25,900 |
| 2021 | $1,416 | $30,380 | $4,480 | $25,900 |
| 2020 | $1,462 | $30,380 | $4,480 | $25,900 |
| 2019 | $1,396 | $26,810 | $4,480 | $22,330 |
| 2018 | $1,396 | $26,810 | $4,480 | $22,330 |
| 2017 | $1,396 | $26,810 | $4,480 | $22,330 |
| 2016 | $1,158 | $25,480 | $4,480 | $21,000 |
| 2015 | $1,035 | $25,480 | $4,480 | $21,000 |
| 2014 | $1,035 | $25,480 | $4,480 | $21,000 |
| 2013 | $1,022 | $25,480 | $4,480 | $21,000 |
Source: Public Records
Map
Nearby Homes
- 16008 Button St
- 14706 Steeplechase Dr
- 15868 Kenwood Dr
- 16298 Weathervane Dr
- 15648 Elmwood St
- 15660 Georgia Rd
- 15100 Timber Ridge Dr
- V/L High Pointe Cir
- 15229 Timber Ridge Dr
- 15142 Sawgrass Ln
- 15243 Woodsong Dr
- 15143 Woodsong Dr
- 15791 Madison Rd
- 16310 Madison Rd
- 15720 Jug Rd
- 13105 Madison Rd
- 13137 Old State Rd
- 16765 Old State Rd
- 13888 Goodwin St
- 8070 Parkman Mesopotamia Rd
- 14912 Thompson Ave
- 14916 Thompson Ave
- 14898 Thompson Ave
- 14920 Thompson Ave
- 14909 Thompson Ave
- 14892 Thompson Ave
- 16016 E High St Unit 105
- 14886 Thompson Ave
- 14903 Thompson Ave
- 16034 E High St
- 16040 E High St
- 14915 Thompson Ave
- 16054 E High St
- 14882 Thompson Ave
- 16054/1605 E High St
- 16052 E High St Unit down
- 16052 E High St
- 14885 Thompson Ave
- 14876 Thompson Ave
- 16060 E High St
Your Personal Tour Guide
Ask me questions while you tour the home.