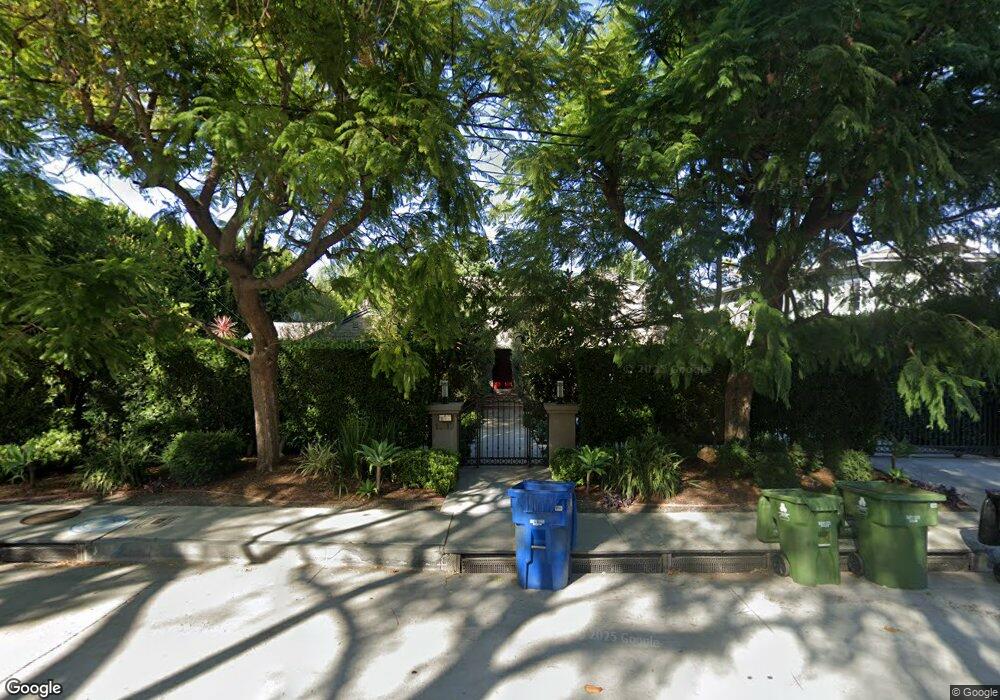
14919 Sutton St Sherman Oaks, CA 91403
Estimated Value: $2,860,000 - $3,059,000
5
Beds
4
Baths
3,541
Sq Ft
$834/Sq Ft
Est. Value
About This Home
This home is located at 14919 Sutton St, Sherman Oaks, CA 91403 and is currently estimated at $2,954,811, approximately $834 per square foot. 14919 Sutton St is a home located in Los Angeles County with nearby schools including Van Nuys High School, Sherman Oaks Elementary Charter School, and Ivy Bound Academy of Math Sci and Tech Charter Middle.
Ownership History
Date
Name
Owned For
Owner Type
Purchase Details
Closed on
Jul 14, 2010
Sold by
Work Jeffrey W and Work Anna W
Bought by
Work Jeffrey W and Work Anna W
Current Estimated Value
Home Financials for this Owner
Home Financials are based on the most recent Mortgage that was taken out on this home.
Original Mortgage
$670,000
Interest Rate
4.52%
Mortgage Type
New Conventional
Purchase Details
Closed on
Jun 6, 2007
Sold by
Work Jeffrey W and Work Anna W
Bought by
Work Jeffrey W and Work Anna W
Purchase Details
Closed on
Sep 23, 2002
Sold by
Work Jeffrey W and Work Anna W
Bought by
Work Jeffrey W and Work Anna W
Create a Home Valuation Report for This Property
The Home Valuation Report is an in-depth analysis detailing your home's value as well as a comparison with similar homes in the area
Home Values in the Area
Average Home Value in this Area
Purchase History
| Date | Buyer | Sale Price | Title Company |
|---|---|---|---|
| Work Jeffrey W | -- | North American Title Company | |
| Work Jeffrey W | -- | North American Title Company | |
| Work Jeffrey W | -- | None Available | |
| Mihjasevic Nedelko | -- | None Available | |
| Work Jeffrey W | -- | -- |
Source: Public Records
Mortgage History
| Date | Status | Borrower | Loan Amount |
|---|---|---|---|
| Closed | Work Jeffrey W | $670,000 |
Source: Public Records
Tax History
| Year | Tax Paid | Tax Assessment Tax Assessment Total Assessment is a certain percentage of the fair market value that is determined by local assessors to be the total taxable value of land and additions on the property. | Land | Improvement |
|---|---|---|---|---|
| 2025 | $17,232 | $1,427,684 | $1,004,183 | $423,501 |
| 2024 | $17,232 | $1,399,692 | $984,494 | $415,198 |
| 2023 | $16,899 | $1,372,248 | $965,191 | $407,057 |
| 2022 | $16,115 | $1,345,342 | $946,266 | $399,076 |
| 2021 | $15,908 | $1,318,963 | $927,712 | $391,251 |
| 2019 | $15,431 | $1,279,845 | $900,197 | $379,648 |
| 2018 | $15,292 | $1,254,751 | $882,547 | $372,204 |
| 2016 | $14,707 | $1,206,029 | $848,278 | $357,751 |
| 2015 | $14,493 | $1,187,915 | $835,537 | $352,378 |
| 2014 | $14,540 | $1,164,646 | $819,170 | $345,476 |
Source: Public Records
Map
Nearby Homes
- 14840 Sutton St
- 14835 Valley Vista Blvd
- 14947 Dickens St Unit 3
- 15102 Greenleaf St
- 15027 Ventura Blvd
- 14948 Moorpark St
- 4054 Stone Canyon Ave
- 15075 Rayneta Dr
- 14664 Valley Vista Blvd
- 4543 Willis Ave Unit 105
- 4543 Willis Ave Unit 102
- 4551 Kester Ave Unit 1
- 15204 Valley Vista Blvd
- 14650 Lacota Place
- 4542 Willis Ave Unit 206
- 4542 Willis Ave Unit 103
- 15213 Del Gado Dr
- 14622 Valley Vista Blvd
- 14600 Dickens St Unit 202
- 4501 Cedros Ave Unit 239
- 14903 Sutton St
- 14933 Sutton St
- 4307 Kester Ave
- 14935 Sutton St
- 4315 Kester Ave
- 14926 Sutton St
- 4321 Kester Ave
- 14904 Greenleaf St
- 14939 Sutton St
- 14908 Greenleaf St
- 4331 Kester Ave
- 14930 Sutton St
- 14916 Greenleaf St
- 14943 Sutton St
- 14860 Greenleaf St
- 14924 Greenleaf St
- 4262 Kester Ave
- 14854 Greenleaf St
- 14858 Sutton St
- 14930 Greenleaf St
Your Personal Tour Guide
Ask me questions while you tour the home.