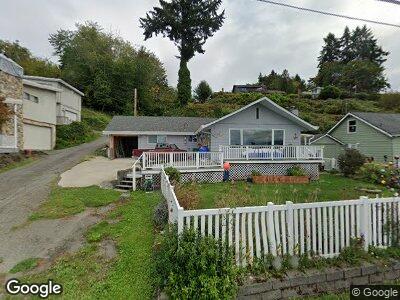
1493 Beach Dr E Port Orchard, WA 98366
Parkwood NeighborhoodEstimated Value: $542,000 - $617,000
3
Beds
1
Bath
1,236
Sq Ft
$460/Sq Ft
Est. Value
About This Home
This home is located at 1493 Beach Dr E, Port Orchard, WA 98366 and is currently estimated at $568,702, approximately $460 per square foot. 1493 Beach Dr E is a home located in Kitsap County with nearby schools including Orchard Heights Elementary School, Marcus Whitman Middle School, and South Kitsap High School.
Ownership History
Date
Name
Owned For
Owner Type
Purchase Details
Closed on
Apr 20, 2018
Sold by
Yargus Sande and Walsh Debra
Bought by
Walsh Debra
Current Estimated Value
Home Financials for this Owner
Home Financials are based on the most recent Mortgage that was taken out on this home.
Original Mortgage
$198,800
Interest Rate
4.44%
Mortgage Type
New Conventional
Purchase Details
Closed on
Oct 16, 2017
Sold by
Yargus Sande
Bought by
Yargus Sande
Home Financials for this Owner
Home Financials are based on the most recent Mortgage that was taken out on this home.
Original Mortgage
$191,300
Interest Rate
3.78%
Mortgage Type
New Conventional
Purchase Details
Closed on
Nov 18, 2011
Sold by
Mcconaghy Diana L
Bought by
Yargus Sande
Home Financials for this Owner
Home Financials are based on the most recent Mortgage that was taken out on this home.
Original Mortgage
$214,285
Interest Rate
3.87%
Mortgage Type
New Conventional
Purchase Details
Closed on
Jun 5, 1996
Sold by
Mcguirk Donald E and Mcguirk Thelma I
Bought by
Sennott Dorothy M
Create a Home Valuation Report for This Property
The Home Valuation Report is an in-depth analysis detailing your home's value as well as a comparison with similar homes in the area
Home Values in the Area
Average Home Value in this Area
Purchase History
| Date | Buyer | Sale Price | Title Company |
|---|---|---|---|
| Walsh Debra | $281 | None Available | |
| Yargus Sande | $281 | Attorney Title | |
| Yargus Sande | $210,280 | Land Title | |
| Sennott Dorothy M | $127,000 | Charter Title Corp |
Source: Public Records
Mortgage History
| Date | Status | Borrower | Loan Amount |
|---|---|---|---|
| Open | Walsh Debra | $229,000 | |
| Closed | Walsh Debra | $50,000 | |
| Closed | Walsh Debra | $198,800 | |
| Previous Owner | Yargus Sande | $191,300 | |
| Previous Owner | Yargus Sande | $214,285 |
Source: Public Records
Tax History Compared to Growth
Tax History
| Year | Tax Paid | Tax Assessment Tax Assessment Total Assessment is a certain percentage of the fair market value that is determined by local assessors to be the total taxable value of land and additions on the property. | Land | Improvement |
|---|---|---|---|---|
| 2025 | $4,660 | $532,810 | $184,390 | $348,420 |
| 2024 | $4,519 | $532,810 | $184,390 | $348,420 |
| 2023 | $4,139 | $489,990 | $167,170 | $322,820 |
| 2022 | $4,143 | $411,240 | $152,420 | $258,820 |
| 2021 | $3,872 | $363,240 | $141,360 | $221,880 |
| 2020 | $3,569 | $324,750 | $122,920 | $201,830 |
| 2019 | $2,411 | $238,170 | $74,020 | $164,150 |
| 2018 | $2,566 | $199,490 | $74,020 | $125,470 |
| 2017 | $2,223 | $199,490 | $74,020 | $125,470 |
| 2016 | $2,210 | $181,570 | $74,020 | $107,550 |
| 2015 | $2,146 | $178,740 | $74,020 | $104,720 |
| 2014 | -- | $175,910 | $74,020 | $101,890 |
| 2013 | -- | $168,790 | $78,270 | $90,520 |
Source: Public Records
Map
Nearby Homes
- 0 E Washington St Unit NWM2337936
- 22 Lots E Washington St
- 0 Beach Dr E Unit NWM2139946
- 1108 Olney Ave E
- 1260 Ridgeway Place E
- 2618 E 3rd St
- 3799 SE Horstman Rd
- 691 SE Olga Cir
- 1200 Baby Doll Rd E
- 1350 Holmes Ave SE
- 318 Perry Ave N Unit 2
- 2979 SE Mile Hill Dr Unit F4
- 2949 SE Mile Hill Dr Unit C7
- 1330 Marlin Dr SE
- 1359 Marlin Dr SE
- 130 Mitchell Ave
- 3900 SE Mile Hill Dr
- 3930 SE Mile Hill Dr
- 884 Cherub Place E
- 103 Rockwell Ave Unit C-28
- 1493 Beach Dr E
- 1499 Beach Dr E
- 1449 Beach Dr E
- 7245 Beach Dr E
- 0 L050 Beach Dr E
- 0 L11 Beach Dr E
- 41 .6AC Beach Dr E
- 2 .42AC Beach Dr E
- 0 LOT 12 Beach Dr E
- 0 LOT 13 Beach Dr E
- 3301 Block Beach Dr E
- 5 Lot Beach Dr E
- 1503 Beach Dr E
- 1427 Beach Dr E
- 1507 Beach Dr E
- 1494 Vaughn Ln E
- 1529 Beach Dr E
- 1413 Beach Dr E
- 2720 E Lidstrom Hill Rd