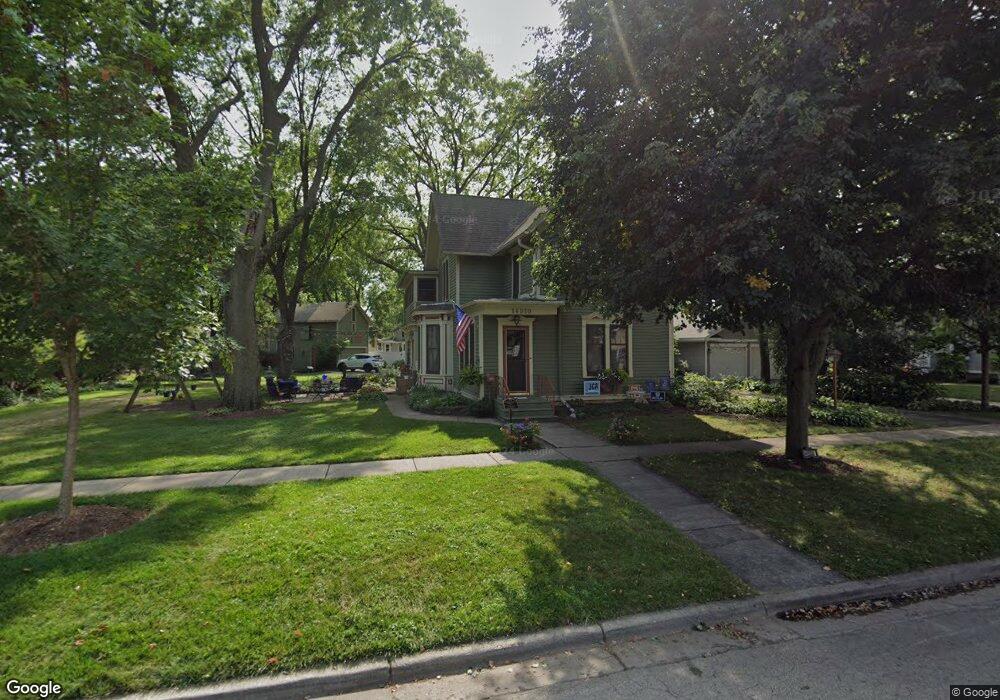
14930 S Illinois St Plainfield, IL 60544
East Plainfield NeighborhoodEstimated Value: $359,000 - $428,000
Studio
--
Bath
2,277
Sq Ft
$172/Sq Ft
Est. Value
About This Home
This home is located at 14930 S Illinois St, Plainfield, IL 60544 and is currently estimated at $391,716, approximately $172 per square foot. 14930 S Illinois St is a home located in Will County with nearby schools including Central Elementary School, Indian Trail Middle School, and Plainfield Central High School.
Ownership History
Date
Name
Owned For
Owner Type
Purchase Details
Closed on
Oct 19, 1999
Sold by
Schwab Linda J and Hustad Raymond G
Bought by
Buss Bryan and Buss Jennifer
Current Estimated Value
Home Financials for this Owner
Home Financials are based on the most recent Mortgage that was taken out on this home.
Original Mortgage
$145,400
Outstanding Balance
$43,735
Interest Rate
7.78%
Estimated Equity
$347,981
Purchase Details
Closed on
Aug 22, 1997
Sold by
Hustad Raymond G and Schwab Linda J
Bought by
Schwab Linda J and Hustad Raymond G
Purchase Details
Closed on
Feb 24, 1994
Sold by
Klett Bradford L and Klett Carol A
Bought by
Hustad Raymond G and Beard Linda J
Home Financials for this Owner
Home Financials are based on the most recent Mortgage that was taken out on this home.
Original Mortgage
$128,235
Interest Rate
7.05%
Mortgage Type
FHA
Create a Home Valuation Report for This Property
The Home Valuation Report is an in-depth analysis detailing your home's value as well as a comparison with similar homes in the area
Home Values in the Area
Average Home Value in this Area
Purchase History
| Date | Buyer | Sale Price | Title Company |
|---|---|---|---|
| Buss Bryan | $182,000 | -- | |
| Schwab Linda J | -- | -- | |
| Hustad Raymond G | $129,000 | -- |
Source: Public Records
Mortgage History
| Date | Status | Borrower | Loan Amount |
|---|---|---|---|
| Open | Buss Bryan | $145,400 | |
| Previous Owner | Hustad Raymond G | $128,235 |
Source: Public Records
Tax History
| Year | Tax Paid | Tax Assessment Tax Assessment Total Assessment is a certain percentage of the fair market value that is determined by local assessors to be the total taxable value of land and additions on the property. | Land | Improvement |
|---|---|---|---|---|
| 2024 | $7,802 | $113,827 | $21,514 | $92,313 |
| 2023 | $7,802 | $102,806 | $19,431 | $83,375 |
| 2022 | $7,218 | $94,922 | $17,941 | $76,981 |
| 2021 | $6,810 | $88,712 | $16,767 | $71,945 |
| 2020 | $6,709 | $86,195 | $16,291 | $69,904 |
| 2019 | $6,466 | $82,130 | $15,523 | $66,607 |
| 2018 | $5,911 | $74,185 | $14,584 | $59,601 |
| 2017 | $5,719 | $70,498 | $13,859 | $56,639 |
| 2016 | $5,570 | $67,237 | $13,218 | $54,019 |
| 2015 | -- | $62,985 | $12,382 | $50,603 |
| 2014 | -- | $62,451 | $18,273 | $44,178 |
| 2013 | -- | $62,451 | $18,273 | $44,178 |
Source: Public Records
Map
Nearby Homes
- 15007 S Illinois St
- 25503 W Emory Ln
- 15111 S Fox River St
- 23909 W Main St
- 000 Wood Farm Rd
- 15405 S Joliet Rd
- 25518 W Stockwell Dr
- 25500 W Alabaster Cir
- 14955 S Mccarthy Cir
- 14853 S Henebry Ln
- 14953 S Mccarthy Cir
- 15001 S Darr Dr
- 25450 W Alabaster Cir
- 14937 S Mccarthy Cir
- 25531 W Alabaster Cir
- 14959 S Mccarthy Cir
- 14849 S Henebry Ln
- 25435 W Alabaster Cir
- 25508 W Alabaster Cir
- 14949 S Mccarthy Cir
- 14926 S Illinois St
- 24032 W Oak St
- 14933 S Des Plaines St
- 15001 S Des Plaines St
- 14929 S Des Plaines St
- 24034 W Oak St
- 15007 S Des Plaines St
- 14931 S Illinois St
- 14933 S Illinois St
- 24022 W Oak St
- 24033 W Oak St
- 610 W Main St
- 15011 S Des Plaines St
- 24114 W Main St
- 24108 W Main St
- 15012 S Illinois St
- 24102 W Main St
- 15002 S Des Plaines St
- 24120 W Main St
- Oak W Oak St
Your Personal Tour Guide
Ask me questions while you tour the home.