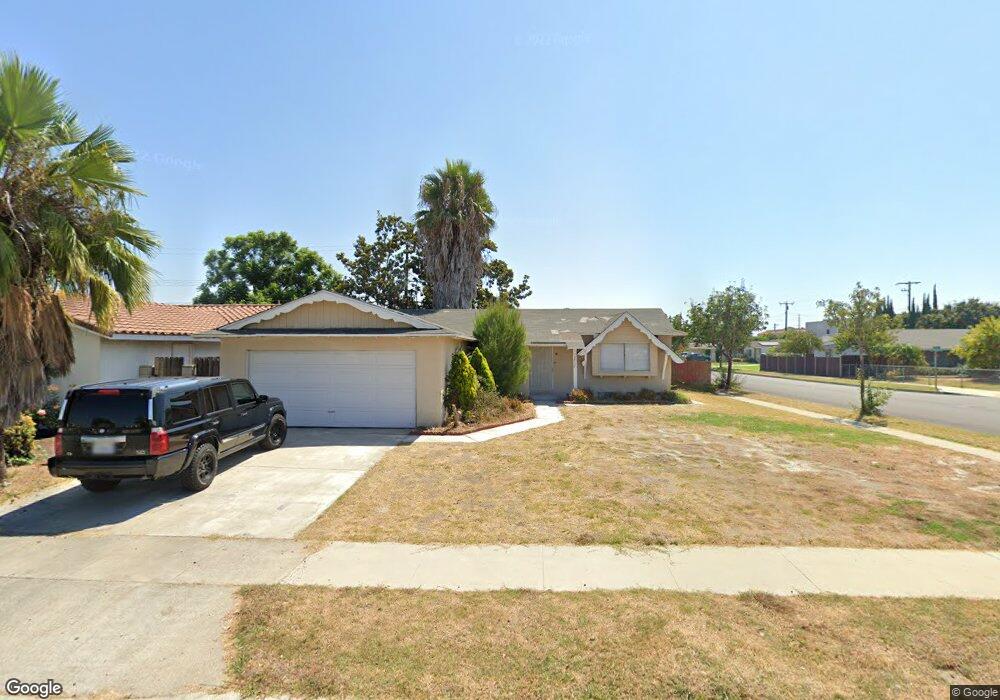
14932 Stengal St Unit Studio Westminster, CA 92683
Little Saigon NeighborhoodEstimated Value: $998,000 - $1,155,127
1
Bed
2
Baths
500
Sq Ft
$2,161/Sq Ft
Est. Value
About This Home
This home is located at 14932 Stengal St Unit Studio, Westminster, CA 92683 and is currently estimated at $1,080,282, approximately $2,160 per square foot. 14932 Stengal St Unit Studio is a home located in Orange County with nearby schools including Post Elementary, James Irvine Intermediate School, and La Quinta High School.
Ownership History
Date
Name
Owned For
Owner Type
Purchase Details
Closed on
Jul 29, 2022
Sold by
Verne William Konig Living Trust
Bought by
Mullen Jeffrey and Mullen Tina
Current Estimated Value
Home Financials for this Owner
Home Financials are based on the most recent Mortgage that was taken out on this home.
Original Mortgage
$607,000
Outstanding Balance
$581,678
Interest Rate
5.81%
Mortgage Type
New Conventional
Estimated Equity
$498,604
Purchase Details
Closed on
Jul 3, 2021
Sold by
Konig Verne W
Bought by
Konig Verne William and The Verne William Konig Living
Purchase Details
Closed on
Apr 18, 1997
Sold by
Konig Io Living Trust
Bought by
Konig Verne W
Purchase Details
Closed on
Jul 28, 1993
Sold by
Konig Io
Bought by
Konig Io and Io Konig Living Trust
Create a Home Valuation Report for This Property
The Home Valuation Report is an in-depth analysis detailing your home's value as well as a comparison with similar homes in the area
Home Values in the Area
Average Home Value in this Area
Purchase History
We collect this data history from publicly available records. To have your information removed, we recommend requesting removal directly through your county’s website.
| Date | Buyer | Sale Price | Title Company |
|---|---|---|---|
| Mullen Jeffrey | $810,000 | Lawyers Title | |
| Konig Verne William | -- | Amrock Inc | |
| Konig Verne W | -- | -- | |
| Konig Io | -- | -- |
Source: Public Records
Mortgage History
We collect this data history from publicly available records. To have your information removed, we recommend requesting removal directly through your county’s website.
| Date | Status | Borrower | Loan Amount |
|---|---|---|---|
| Open | Mullen Jeffrey | $607,000 |
Source: Public Records
Tax History
| Year | Tax Paid | Tax Assessment Tax Assessment Total Assessment is a certain percentage of the fair market value that is determined by local assessors to be the total taxable value of land and additions on the property. | Land | Improvement |
|---|---|---|---|---|
| 2025 | $12,281 | $1,064,999 | $777,816 | $287,183 |
| 2024 | $12,281 | $987,177 | $762,565 | $224,612 |
| 2023 | $9,578 | $810,000 | $747,613 | $62,387 |
| 2022 | $1,543 | $80,894 | $40,458 | $40,436 |
| 2021 | $1,506 | $79,308 | $39,664 | $39,644 |
| 2020 | $1,490 | $78,495 | $39,257 | $39,238 |
| 2019 | $1,472 | $76,956 | $38,487 | $38,469 |
| 2018 | $1,450 | $75,448 | $37,733 | $37,715 |
| 2017 | $1,434 | $73,969 | $36,993 | $36,976 |
| 2016 | $1,393 | $72,519 | $36,268 | $36,251 |
| 2015 | $1,376 | $71,430 | $35,723 | $35,707 |
| 2014 | $1,350 | $70,031 | $35,023 | $35,008 |
Source: Public Records
Map
Nearby Homes
- 14842 Deanann Place
- 10200 Bolsa Ave Unit 91
- 10200 Bolsa Ave Unit 126
- 10200 Bolsa Ave Unit 141
- 10200 Bolsa Ave Unit 111
- 10200 Bolsa Ave Unit 100
- 10200 Bolsa Ave Unit 34
- 10572 Torrington Cir
- 10632 Henderson Ave
- 10091 Decima Dr
- 9851 Bolsa Ave Unit 175
- 9851 Bolsa Ave Unit 7
- 14356 Taft St
- 10191 Morningside Dr
- 9889 Bria Ln
- 9906 13th St
- 13322 Euclid St
- 9820 Calendula Ave
- 5336 W Wisteria Place
- 4828 W 5th St Unit E
- 14932 Stengal St
- 14922 Stengal St
- 14931 Bowen St
- 14921 Bowen St
- 14912 Stengal St
- 14951 Stengal St
- 14952 Stengal St
- 14911 Bowen St
- 14931 Stengal St
- 14921 Stengal St
- 14902 Stengal St
- 14911 Stengal St
- 14961 Stengal St
- 14962 Stengal St
- 14901 Bowen St
- 10422 Stern Ave
- 10382 Stern Ave
- 14901 Stengal St
- 14892 Stengal St
- 14932 Booney St
Your Personal Tour Guide
Ask me questions while you tour the home.