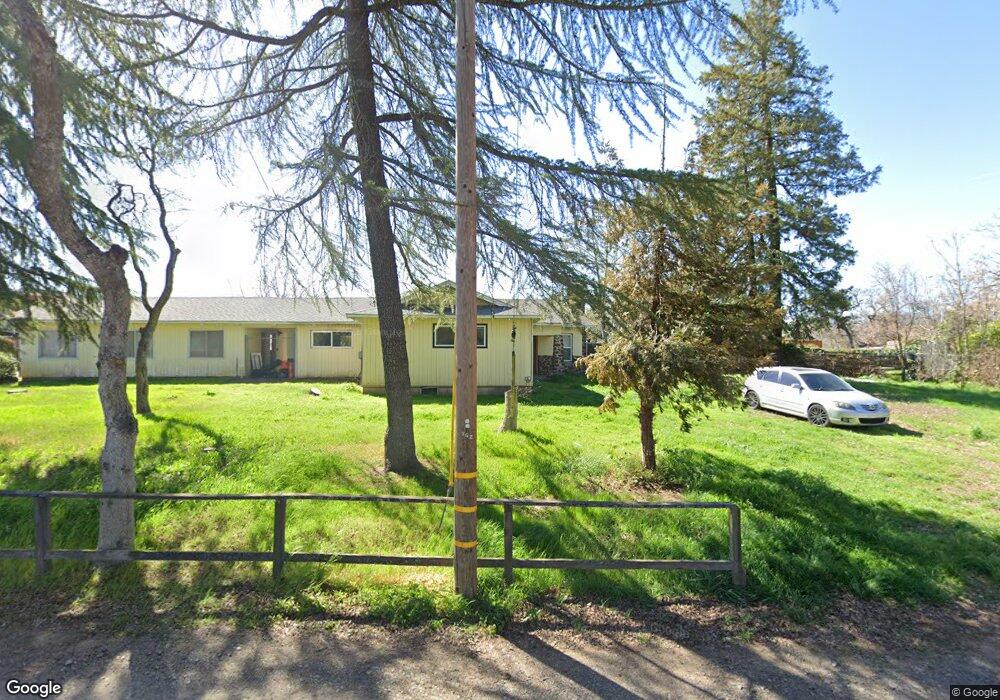
14935 Lelabelle Blvd Clearlake, CA 95422
Estimated Value: $293,328 - $357,000
2
Beds
2
Baths
1,796
Sq Ft
$184/Sq Ft
Est. Value
About This Home
This home is located at 14935 Lelabelle Blvd, Clearlake, CA 95422 and is currently estimated at $329,832, approximately $183 per square foot. 14935 Lelabelle Blvd is a home located in Lake County with nearby schools including Lower Lake High School, Henderson Schoolhouse, and Clearlake Seventh-day Adventist Christian School.
Ownership History
Date
Name
Owned For
Owner Type
Purchase Details
Closed on
Dec 17, 2012
Sold by
Mayfield Michael K and Mayfield Barbara B
Bought by
Mbkk Enterprises Llc
Current Estimated Value
Purchase Details
Closed on
Dec 12, 2012
Sold by
Mayfield Investment Company
Bought by
Mayfield Michael K
Purchase Details
Closed on
Dec 19, 2007
Sold by
Mayfield Investment Co
Bought by
Mayfield Investment Co
Purchase Details
Closed on
Sep 5, 2007
Sold by
Mayfield Joe and Mayfield Diane
Bought by
Mayfield Investment Co
Purchase Details
Closed on
Oct 26, 2005
Sold by
Mayfield Investment Co
Bought by
Mayfield Investment Co
Home Financials for this Owner
Home Financials are based on the most recent Mortgage that was taken out on this home.
Original Mortgage
$1,500,000
Interest Rate
5.74%
Mortgage Type
Construction
Create a Home Valuation Report for This Property
The Home Valuation Report is an in-depth analysis detailing your home's value as well as a comparison with similar homes in the area
Home Values in the Area
Average Home Value in this Area
Purchase History
| Date | Buyer | Sale Price | Title Company |
|---|---|---|---|
| Mbkk Enterprises Llc | $150,000 | None Available | |
| Mayfield Michael K | $150,000 | None Available | |
| Mayfield Investment Co | -- | First American Title Company | |
| Mayfield Investment Co | -- | First American Title Company | |
| Mayfield Investment Co | -- | None Available | |
| Mayfield Investment Co | -- | First American Title |
Source: Public Records
Mortgage History
| Date | Status | Borrower | Loan Amount |
|---|---|---|---|
| Previous Owner | Mayfield Investment Co | $1,500,000 |
Source: Public Records
Tax History Compared to Growth
Tax History
| Year | Tax Paid | Tax Assessment Tax Assessment Total Assessment is a certain percentage of the fair market value that is determined by local assessors to be the total taxable value of land and additions on the property. | Land | Improvement |
|---|---|---|---|---|
| 2025 | $2,126 | $174,940 | $43,497 | $131,443 |
| 2024 | $2,101 | $171,511 | $42,645 | $128,866 |
| 2023 | $2,076 | $168,149 | $41,809 | $126,340 |
| 2022 | $1,971 | $164,853 | $40,990 | $123,863 |
| 2021 | $2,020 | $161,622 | $40,187 | $121,435 |
| 2020 | $2,009 | $159,965 | $39,775 | $120,190 |
| 2019 | $1,924 | $156,830 | $38,996 | $117,834 |
| 2018 | $1,925 | $153,756 | $38,232 | $115,524 |
| 2017 | $1,834 | $150,742 | $37,483 | $113,259 |
| 2016 | $1,697 | $147,788 | $36,749 | $111,039 |
| 2015 | $1,667 | $145,569 | $36,197 | $109,372 |
| 2014 | $1,633 | $142,718 | $35,488 | $107,230 |
Source: Public Records
Map
Nearby Homes
- 14998 Lelabelle Blvd
- 15135 Konocti View
- 5545 Old Hwy 53 None Unit 7
- 5575 Old Highway 53 Unit 7
- 5575 Old Highway 53 Unit 29
- 5575 Old Highway 53 Unit 43
- 4940 Spruce St
- 4788 Yarrington Ct
- 15275 Konocti View
- 5607 Jones Ave
- 5834 Spruce Ave
- 14918 Lakeshore Dr
- 5714 Huron Ave
- 4535 Old Highway 53
- 5614 Crawford Ave
- 4744 W 40th St
- 5560 Hale Ave
- 5030 Crawford Ave
- 4392 Lasky Ave
- 15316 Brannan St
- 14940 Lelabelle Blvd
- 14930 Lelabelle Blvd
- 14920 Lelabelle Blvd
- 14960 Lelabelle Blvd
- 14900 Lelabelle Blvd
- 14997 Wayland Way
- 5380 Weyland Ave
- 14890 Lelabelle Blvd
- 14945 Laguna Ave
- 14935 Laguna Ave
- 14955 Lelabelle Blvd
- 14925 Laguna Ave
- 14965 Laguna Ave
- 14880 Lelabelle Blvd
- 14975 Laguna Ave
- 14915 Laguna Ave
- 14978 Lelabelle Blvd
- 5425 Weyland Ave
- 14979 Laguna Ave
- 14870 Lelabelle Blvd