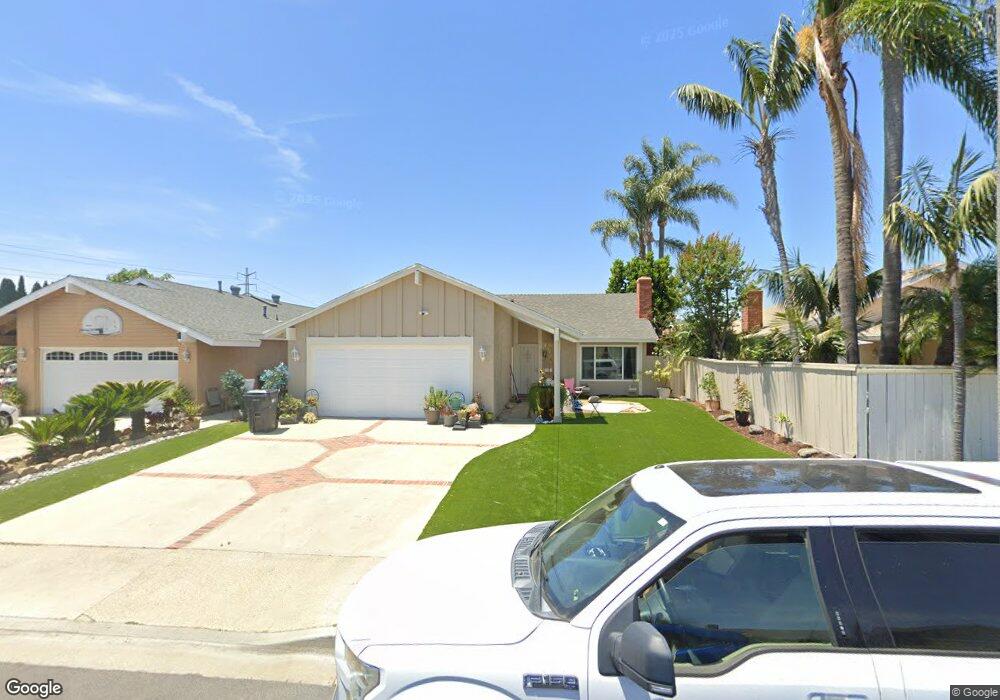
14941 Burnham Cir Irvine, CA 92604
Walnut NeighborhoodEstimated Value: $1,231,147 - $1,380,000
4
Beds
2
Baths
1,156
Sq Ft
$1,140/Sq Ft
Est. Value
About This Home
This home is located at 14941 Burnham Cir, Irvine, CA 92604 and is currently estimated at $1,317,787, approximately $1,139 per square foot. 14941 Burnham Cir is a home located in Orange County with nearby schools including Greentree Elementary School, Venado Middle School, and Irvine High School.
Ownership History
Date
Name
Owned For
Owner Type
Purchase Details
Closed on
Sep 14, 2016
Sold by
Wiebe Christine J
Bought by
Wiebe Christine J and Christine J Wiebe Living Trust
Current Estimated Value
Home Financials for this Owner
Home Financials are based on the most recent Mortgage that was taken out on this home.
Original Mortgage
$357,000
Outstanding Balance
$285,158
Interest Rate
3.43%
Mortgage Type
New Conventional
Estimated Equity
$1,032,629
Purchase Details
Closed on
Nov 10, 2014
Sold by
Wiebe Christine J
Bought by
Wiebe Christine J and Christine J Wiebe Living Trust
Purchase Details
Closed on
Mar 25, 2003
Sold by
Fix John T and Fix Lesa
Bought by
Wiebe Christine J
Home Financials for this Owner
Home Financials are based on the most recent Mortgage that was taken out on this home.
Original Mortgage
$314,400
Interest Rate
5.54%
Purchase Details
Closed on
Mar 15, 1994
Sold by
Koch Thomas William
Bought by
Fix John T
Create a Home Valuation Report for This Property
The Home Valuation Report is an in-depth analysis detailing your home's value as well as a comparison with similar homes in the area
Home Values in the Area
Average Home Value in this Area
Purchase History
| Date | Buyer | Sale Price | Title Company |
|---|---|---|---|
| Wiebe Christine J | -- | Accommodation | |
| Wiebe Christine J | -- | Lawyers Title Company | |
| Wiebe Christine J | -- | None Available | |
| Wiebe Christine J | $393,000 | Commonwealth Title | |
| Fix John T | $192,500 | South Coast Title Company |
Source: Public Records
Mortgage History
| Date | Status | Borrower | Loan Amount |
|---|---|---|---|
| Open | Wiebe Christine J | $357,000 | |
| Closed | Wiebe Christine J | $314,400 | |
| Closed | Wiebe Christine J | $58,950 |
Source: Public Records
Tax History Compared to Growth
Tax History
| Year | Tax Paid | Tax Assessment Tax Assessment Total Assessment is a certain percentage of the fair market value that is determined by local assessors to be the total taxable value of land and additions on the property. | Land | Improvement |
|---|---|---|---|---|
| 2025 | $5,923 | $569,184 | $480,067 | $89,117 |
| 2024 | $5,923 | $558,024 | $470,654 | $87,370 |
| 2023 | $5,769 | $547,083 | $461,426 | $85,657 |
| 2022 | $5,655 | $536,356 | $452,378 | $83,978 |
| 2021 | $5,524 | $525,840 | $443,508 | $82,332 |
| 2020 | $5,492 | $520,449 | $438,961 | $81,488 |
| 2019 | $5,370 | $510,245 | $430,354 | $79,891 |
| 2018 | $5,273 | $500,241 | $421,916 | $78,325 |
| 2017 | $5,163 | $490,433 | $413,643 | $76,790 |
| 2016 | $4,935 | $480,817 | $405,532 | $75,285 |
| 2015 | $4,861 | $473,595 | $399,440 | $74,155 |
| 2014 | $4,766 | $464,318 | $391,615 | $72,703 |
Source: Public Records
Map
Nearby Homes
- 4862 Gainsport Cir
- 14612 Highcrest Cir
- 15202 Marne Cir
- 32 Goldenbush
- 15071 Talley St
- 20 Sacramento Unit 10
- 45 Golden Glen St Unit 75
- 32 Kazan St Unit 18
- 14942 Dahlquist Rd
- 4 Wintergreen Unit 4
- 4071 Loma St
- 26 Helena Unit 69
- 27 Cheyenne Unit 69
- 10 Raleigh
- 15232 Lille Cir
- 22 Firebird Unit 71
- 14851 Jeffrey Rd Unit 246
- 14851 Jeffrey Rd Unit 61
- 14851 Jeffrey Rd Unit 25
- 14851 Jeffrey Rd Unit 352
- 14931 Burnham Cir
- 14951 Burnham Cir
- 14921 Burnham Cir
- 14942 Gainford Cir
- 14952 Gainford Cir
- 14932 Gainford Cir
- 14922 Gainford Cir
- 14911 Burnham Cir
- 14942 Burnham Cir
- 14932 Burnham Cir
- 14952 Burnham Cir
- 14912 Gainford Cir
- 4642 Roxbury Dr
- 14922 Burnham Cir
- 4636 Roxbury Dr
- 14901 Burnham Cir
- 4652 Roxbury Dr
- 4632 Roxbury Dr
- 4662 Roxbury Dr
- 14902 Gainford Cir