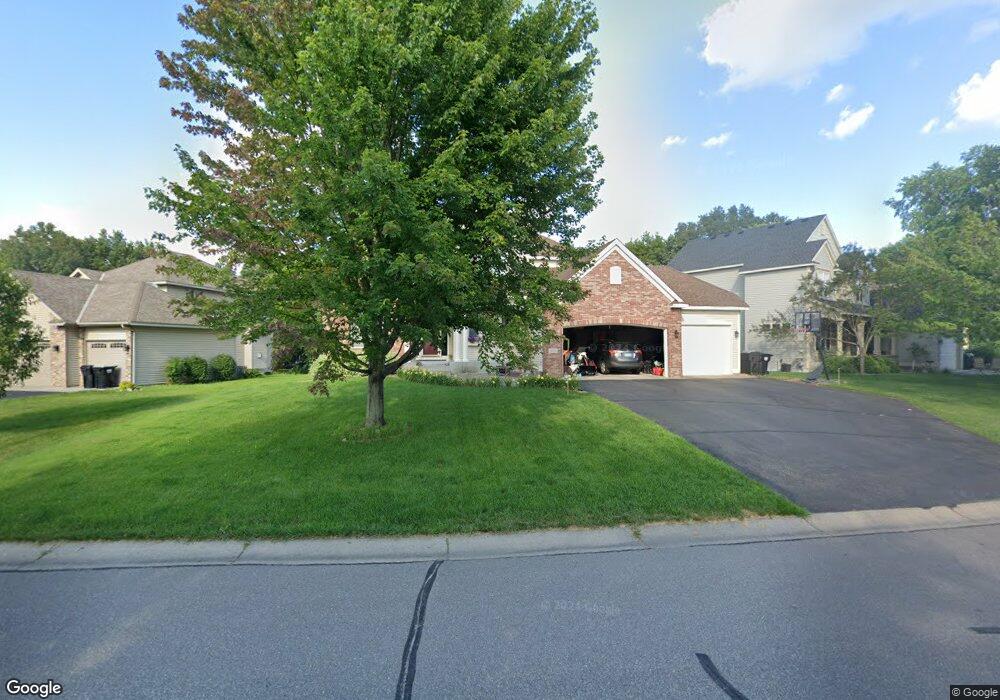
14941 Uplander St NW Andover, MN 55304
Estimated Value: $559,000 - $588,000
4
Beds
4
Baths
3,495
Sq Ft
$164/Sq Ft
Est. Value
About This Home
This home is located at 14941 Uplander St NW, Andover, MN 55304 and is currently estimated at $573,325, approximately $164 per square foot. 14941 Uplander St NW is a home located in Anoka County with nearby schools including Andover Elementary School, Oak View Middle School, and Andover Senior High School.
Ownership History
Date
Name
Owned For
Owner Type
Purchase Details
Closed on
Jun 29, 2020
Sold by
Mcintyre Brock J and Michael J Campbell Trust
Bought by
Carter Amanda Brooke and Gripentrog Stephen Zachariah
Current Estimated Value
Home Financials for this Owner
Home Financials are based on the most recent Mortgage that was taken out on this home.
Original Mortgage
$363,800
Outstanding Balance
$322,594
Interest Rate
3.1%
Mortgage Type
New Conventional
Estimated Equity
$250,731
Purchase Details
Closed on
Jun 5, 2014
Sold by
Campbell Heather Ann
Bought by
Campbell Michael James
Purchase Details
Closed on
Dec 10, 1999
Sold by
Hanson Builders Inc
Bought by
Campbell Michael J and Campbell Heather A
Purchase Details
Closed on
Nov 13, 1998
Sold by
Laptuta Walter and Laptuta Rosemary
Bought by
Woodland Development Corp
Create a Home Valuation Report for This Property
The Home Valuation Report is an in-depth analysis detailing your home's value as well as a comparison with similar homes in the area
Home Values in the Area
Average Home Value in this Area
Purchase History
| Date | Buyer | Sale Price | Title Company |
|---|---|---|---|
| Carter Amanda Brooke | $428,000 | None Available | |
| Campbell Michael James | -- | None Available | |
| Campbell Michael J | $291,341 | -- | |
| Hanson Builders Inc | $38,900 | -- | |
| Woodland Development Corp | $1,819,840 | -- |
Source: Public Records
Mortgage History
| Date | Status | Borrower | Loan Amount |
|---|---|---|---|
| Open | Carter Amanda Brooke | $363,800 | |
| Closed | Woodland Development Corp | -- |
Source: Public Records
Tax History Compared to Growth
Tax History
| Year | Tax Paid | Tax Assessment Tax Assessment Total Assessment is a certain percentage of the fair market value that is determined by local assessors to be the total taxable value of land and additions on the property. | Land | Improvement |
|---|---|---|---|---|
| 2025 | $5,342 | $545,900 | $117,000 | $428,900 |
| 2024 | $5,342 | $513,900 | $97,500 | $416,400 |
| 2023 | $4,780 | $506,800 | $94,600 | $412,200 |
| 2022 | $4,533 | $511,400 | $90,100 | $421,300 |
| 2021 | $4,418 | $419,700 | $58,100 | $361,600 |
| 2020 | $4,541 | $400,100 | $58,100 | $342,000 |
| 2019 | $4,409 | $398,300 | $50,700 | $347,600 |
| 2018 | $4,482 | $379,800 | $0 | $0 |
| 2017 | $3,956 | $377,900 | $0 | $0 |
| 2016 | $4,043 | $326,000 | $0 | $0 |
| 2015 | $3,847 | $326,000 | $61,200 | $264,800 |
| 2014 | -- | $291,300 | $58,500 | $232,800 |
Source: Public Records
Map
Nearby Homes
- 2334 Veterans Memorial Blvd NW
- 2080 151st Ave NW
- 2066 151st Ave NW
- 15285 Quinn St NW
- 14404 Osage St NW
- 14780 Jay St NW
- 14395 Partridge St NW
- 15570 Linnet St NW Unit 2305
- 15570 Linnet St NW Unit 2205
- 14553 Ibis St NW
- 1769 155th Ave NW
- 15631 Linnet St NW Unit 3210
- 15631 Linnet St NW Unit 109
- 15631 Linnet St NW Unit 3305
- 1684 155th Ave NW
- 14994 Crane St NW
- 15832 Uplander St NW
- 13993 Crosstown Blvd NW
- 1722 157th Ln NW
- 15988 Quinn St NW
- 14957 Uplander St NW
- 14925 Uplander St NW
- 14971 Uplander St NW
- 2343 149th Ave NW
- 14948 Uplander St NW
- 14936 Uplander St NW
- 14926 Uplander St NW
- 14962 Uplander St NW
- 2323 149th Ave NW
- 14916 Uplander St NW
- 14974 Uplander St NW
- 2356 150th Ave NW
- 2342 150th Ave NW
- 2350 149th Ave NW
- 2328 150th Ave NW
- 2338 149th Ave NW
- 14986 Uplander St NW
- 2316 150th Ave NW
- 2305 149th Ave NW
- 2326 149th Ave NW