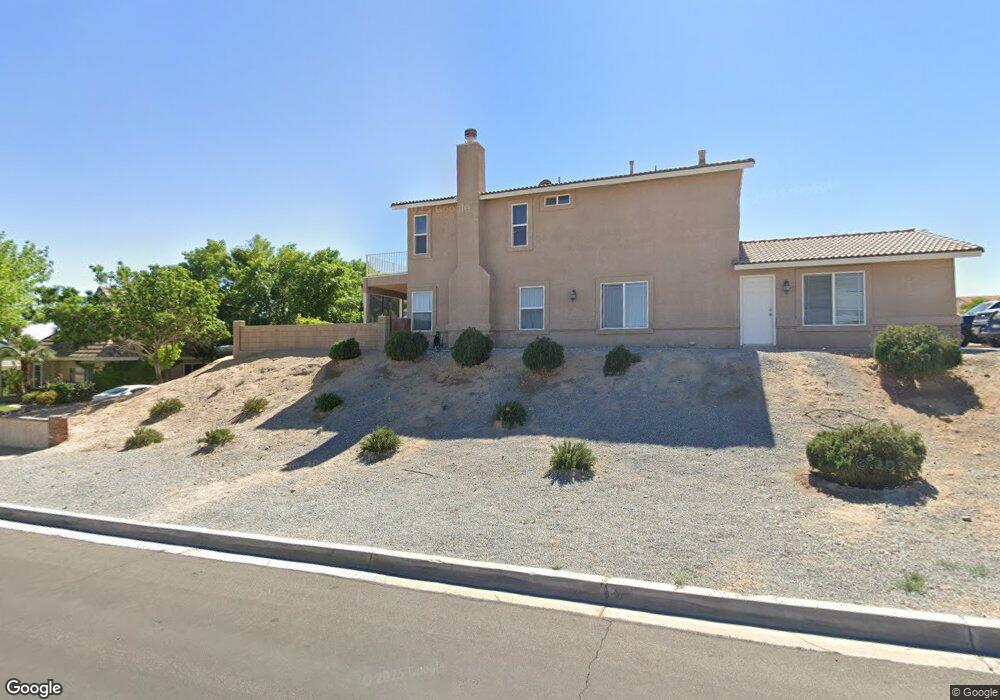
14943 Fireside Ln Helendale, CA 92342
Estimated Value: $418,000 - $449,000
4
Beds
2
Baths
2,516
Sq Ft
$173/Sq Ft
Est. Value
About This Home
This home is located at 14943 Fireside Ln, Helendale, CA 92342 and is currently estimated at $435,702, approximately $173 per square foot. 14943 Fireside Ln is a home located in San Bernardino County with nearby schools including Helendale Elementary School, Riverview Middle School, and Adelanto High School.
Ownership History
Date
Name
Owned For
Owner Type
Purchase Details
Closed on
Apr 16, 2010
Sold by
Ramirez Carlos E
Bought by
Galvez Hugo
Current Estimated Value
Home Financials for this Owner
Home Financials are based on the most recent Mortgage that was taken out on this home.
Original Mortgage
$99,000
Outstanding Balance
$66,620
Interest Rate
5.21%
Mortgage Type
New Conventional
Estimated Equity
$369,082
Purchase Details
Closed on
Mar 17, 2006
Sold by
Ramirez Celeste
Bought by
Ramirez Carlos E
Purchase Details
Closed on
Feb 9, 2006
Sold by
Hakanson Margaret and The Estate Of W Patrick Rayney
Bought by
Ramirez Carlos E
Purchase Details
Closed on
Feb 19, 2003
Sold by
Rayney Rosemary and Rayney Rosemarie E
Bought by
Rayney W Patrick
Purchase Details
Closed on
Dec 2, 1998
Sold by
Mardesich John and Mardesich Rene
Bought by
Rayney W Patrick and Rayney Rosemarie E
Create a Home Valuation Report for This Property
The Home Valuation Report is an in-depth analysis detailing your home's value as well as a comparison with similar homes in the area
Home Values in the Area
Average Home Value in this Area
Purchase History
| Date | Buyer | Sale Price | Title Company |
|---|---|---|---|
| Galvez Hugo | $165,000 | Fidelity Title | |
| Ramirez Carlos E | -- | First American | |
| Ramirez Carlos E | $81,500 | First American | |
| Rayney W Patrick | -- | First American | |
| Rayney W Patrick | $7,000 | Fidelity National Title Co |
Source: Public Records
Mortgage History
| Date | Status | Borrower | Loan Amount |
|---|---|---|---|
| Open | Galvez Hugo | $99,000 |
Source: Public Records
Tax History
| Year | Tax Paid | Tax Assessment Tax Assessment Total Assessment is a certain percentage of the fair market value that is determined by local assessors to be the total taxable value of land and additions on the property. | Land | Improvement |
|---|---|---|---|---|
| 2025 | $2,956 | $212,987 | $63,896 | $149,091 |
| 2024 | $2,762 | $208,811 | $62,643 | $146,168 |
| 2023 | $2,741 | $204,717 | $61,415 | $143,302 |
| 2022 | $2,705 | $200,703 | $60,211 | $140,492 |
| 2021 | $2,655 | $196,767 | $59,030 | $137,737 |
| 2020 | $2,605 | $194,750 | $58,425 | $136,325 |
| 2019 | $2,580 | $190,931 | $57,279 | $133,652 |
| 2018 | $2,680 | $187,187 | $56,156 | $131,031 |
| 2017 | $2,496 | $183,517 | $55,055 | $128,462 |
| 2016 | $2,468 | $179,918 | $53,975 | $125,943 |
| 2015 | $2,343 | $177,215 | $53,164 | $124,051 |
| 2014 | $2,370 | $173,744 | $52,123 | $121,621 |
Source: Public Records
Map
Nearby Homes
- 27220 Strawberry Ln
- 0 Strawberry Ln Unit HD24135524
- 27182 Strawberry Ln
- 14910 Fireside Ln
- 27325 Strawberry Ln
- 14874 Autumn Ln
- 0 Autumn Ln
- 27160 Vista Rd Unit 38
- 27160 Vista Rd Unit 37
- 27160 Vista Rd Unit 43
- 27160 Vista Rd Unit 36
- 27160 Vista Rd Unit 45
- 27237 Peach Tree Ln
- 14852 Autumn Ln
- 27449 Lakeview Dr
- 27231 Peach Tree Ln
- 8133 Helendale Rd
- 0 Bonita Ln Unit HD24122126
- 27424 Cloverleaf Dr
- 27535 Lakeview Dr
- 14933 Fireside Ln
- 27280 Strawberry Ln
- 0 Fireside Ln
- 1 Fireside Ln
- 14923 Fireside Ln
- 27270 Strawberry Ln
- 27253 Aspen Ct
- 14930 Fireside Ln
- 14920 Fireside Ln Unit 1827
- 14920 Fireside Ln
- 14920 Fireside Ln Unit 1863
- 27260 Strawberry Ln
- 27315 Strawberry Ln
- 14903 Fireside Ln
- 27247 Aspen Ct
- 27250 Strawberry Ln
- 27334 Strawberry Ln
- 8316 277 Aspen Ct
- 8316 Aspen Ct
- 0 Aspen Ct
Your Personal Tour Guide
Ask me questions while you tour the home.