Estimated Value: $350,000 - $372,000
3
Beds
3
Baths
1,920
Sq Ft
$189/Sq Ft
Est. Value
About This Home
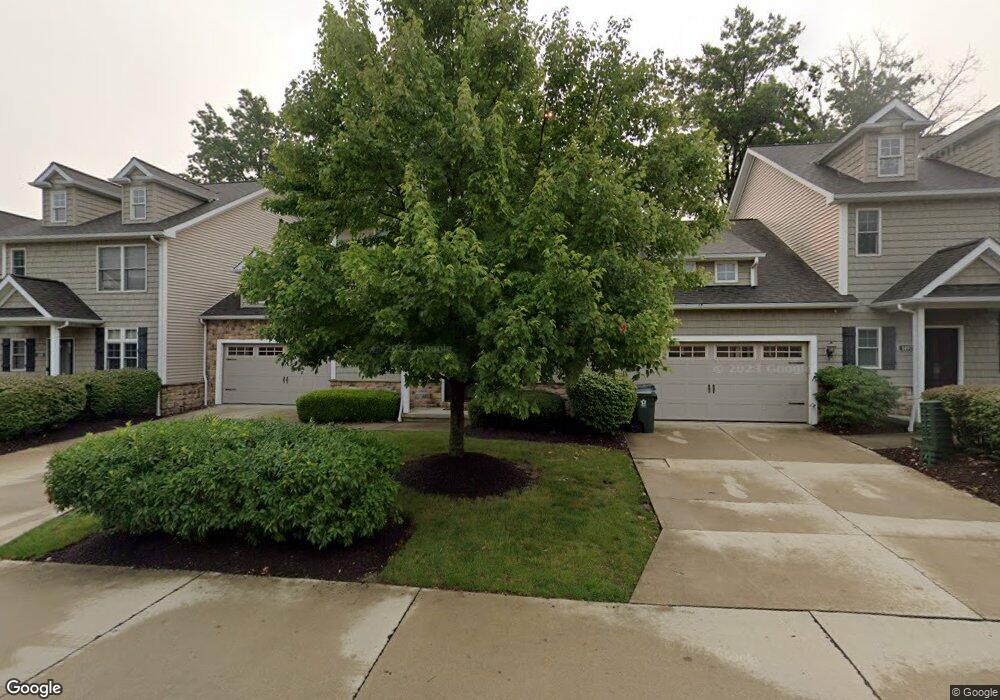
This home is located at 1495 Chenin Run Unit 11, Avon, OH 44011 and is currently estimated at $363,034, approximately $189 per square foot. 1495 Chenin Run Unit 11 is a home located in Lorain County with nearby schools including Avon Heritage South Elementary School, Avon East Elementary School, and Avon Middle School.
Ownership History
Date
Name
Owned For
Owner Type
Purchase Details
Closed on
May 13, 2019
Sold by
Schafer Properties Iv Llc
Bought by
Concord Village Phase One Llc
Current Estimated Value
Home Financials for this Owner
Home Financials are based on the most recent Mortgage that was taken out on this home.
Original Mortgage
$2,960,000
Outstanding Balance
$2,591,813
Interest Rate
4%
Mortgage Type
Future Advance Clause Open End Mortgage
Estimated Equity
-$2,228,779
Purchase Details
Closed on
Jul 21, 2010
Sold by
Schafer Development Company Inc
Bought by
Schafer Properties Iv Llc
Home Financials for this Owner
Home Financials are based on the most recent Mortgage that was taken out on this home.
Original Mortgage
$1,900,000
Interest Rate
4.6%
Mortgage Type
Purchase Money Mortgage
Create a Home Valuation Report for This Property
The Home Valuation Report is an in-depth analysis detailing your home's value as well as a comparison with similar homes in the area
Home Values in the Area
Average Home Value in this Area
Purchase History
| Date | Buyer | Sale Price | Title Company |
|---|---|---|---|
| Concord Village Phase One Llc | $3,850,000 | Ohio Title Corp | |
| Schafer Properties Iv Llc | $2,780,600 | Lawyers Title Co |
Source: Public Records
Mortgage History
| Date | Status | Borrower | Loan Amount |
|---|---|---|---|
| Open | Concord Village Phase One Llc | $2,960,000 | |
| Previous Owner | Schafer Properties Iv Llc | $1,900,000 |
Source: Public Records
Tax History Compared to Growth
Tax History
| Year | Tax Paid | Tax Assessment Tax Assessment Total Assessment is a certain percentage of the fair market value that is determined by local assessors to be the total taxable value of land and additions on the property. | Land | Improvement |
|---|---|---|---|---|
| 2024 | $5,512 | $109,592 | $31,920 | $77,672 |
| 2023 | $4,309 | $76,136 | $19,373 | $56,763 |
| 2022 | $4,269 | $76,136 | $19,373 | $56,763 |
| 2021 | $4,277 | $76,136 | $19,373 | $56,763 |
| 2020 | $4,272 | $71,340 | $17,500 | $53,840 |
| 2019 | $4,188 | $71,340 | $17,500 | $53,840 |
| 2018 | $3,673 | $71,340 | $17,500 | $53,840 |
| 2017 | $3,458 | $59,120 | $14,180 | $44,940 |
| 2016 | $4,387 | $74,100 | $17,780 | $56,320 |
| 2015 | $4,430 | $74,100 | $17,780 | $56,320 |
| 2014 | $3,906 | $65,640 | $15,750 | $49,890 |
| 2013 | $3,927 | $65,640 | $15,750 | $49,890 |
Source: Public Records
Map
Nearby Homes
- 1424 Chateau Place
- 1986 W Reserve Cir Unit 70
- 0 Center Rd Unit 5169281
- 1951 Sandalwood Dr
- 1927 Center Rd
- 35666 Schneider Ct
- 2244 Candlewood Dr
- 2143 Eaton Dr
- 772 Wildberry Cir
- 37865 Lorie Blvd
- 1129 Windmill Way N
- 1948 Buckingham Dr
- 32750 Belmont Dr
- 32825 Rebecca Ln
- 32866 Rebecca Ln
- 2148 Southampton Ln
- 0 Detroit Rd Unit 5090789
- 0 Detroit Rd Unit 5098540
- 1908 Pembrooke Ln
- 2161 Southampton Ln
- 1497 Chenin Run Unit 10
- 1493 Chenin Run Unit 12
- 1469 Chenin Run
- 1467 Chenin Run
- 33611 Bordeaux
- 1499 Chenin Run Unit 9
- 1491 Chenin Run Unit 13
- 36611 Bordeaux
- 30 Chenin Run
- 36631 Chenin Run
- 36621 Bordeaux
- 1489 Chenin Run Unit 22
- 36630 Bordeaux Unit 20
- 36610 Bordeaux Unit 19
- 36601 Bordeaux
- 1487 Chenin Run Unit 23
- 36600 Bordeaux Unit 21
- 36620 Bordeaux Unit 18
- 36631 Bordeaux
- 36661 Bordeaux Unit 18